

Question: The data below is given. 1. Please download the dataset Showtimexlsx 'om Canvas. The dataset Showtime.xlsx givII the data on weekly gross revenue (y), television
The data below is given.
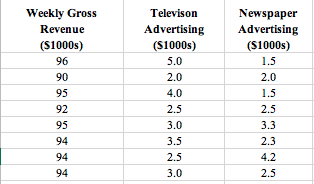
1. Please download the dataset \"Showtimexlsx\" 'om Canvas. The dataset \"Showtime.xlsx\" givII the data on weekly gross revenue (y), television advertising (1:1), and newspaper advertising (:62) for Showtime Movie Theaters. Use hnitah to help you answer the following quIItions. a) Develop an estimated regression equation to predict Weekly Gross Revenue {y} using Television Advertising {x1} and Newspaper Advertising {1:2} as the independent variables. b) Plot the standardized residuals against 3?. 1What assumption about 8 you are checking here? Does the plot support the assumptions about E? Explain. c) Get a list of standardized residuals, standardized deleted residuals, leverages, and Cook's Distances. d) Are there any outliers? Please use each of the two methods of standardized residuals, standardized deleted residuals SEPERATELY to detect outliers. Explain them clearly. e) Are there any influential observations? Please use each of the two methods of leverages, and Cook's Distances SEPERATELY to detect inuential observations. Explain them \f
Step by Step Solution
There are 3 Steps involved in it

Get step-by-step solutions from verified subject matter experts