

Question: The data below represent a demand schedule. Product Price Quantity Demanded $ 30 10 25 20 20 30 15 40 10 50 Using the midpoint
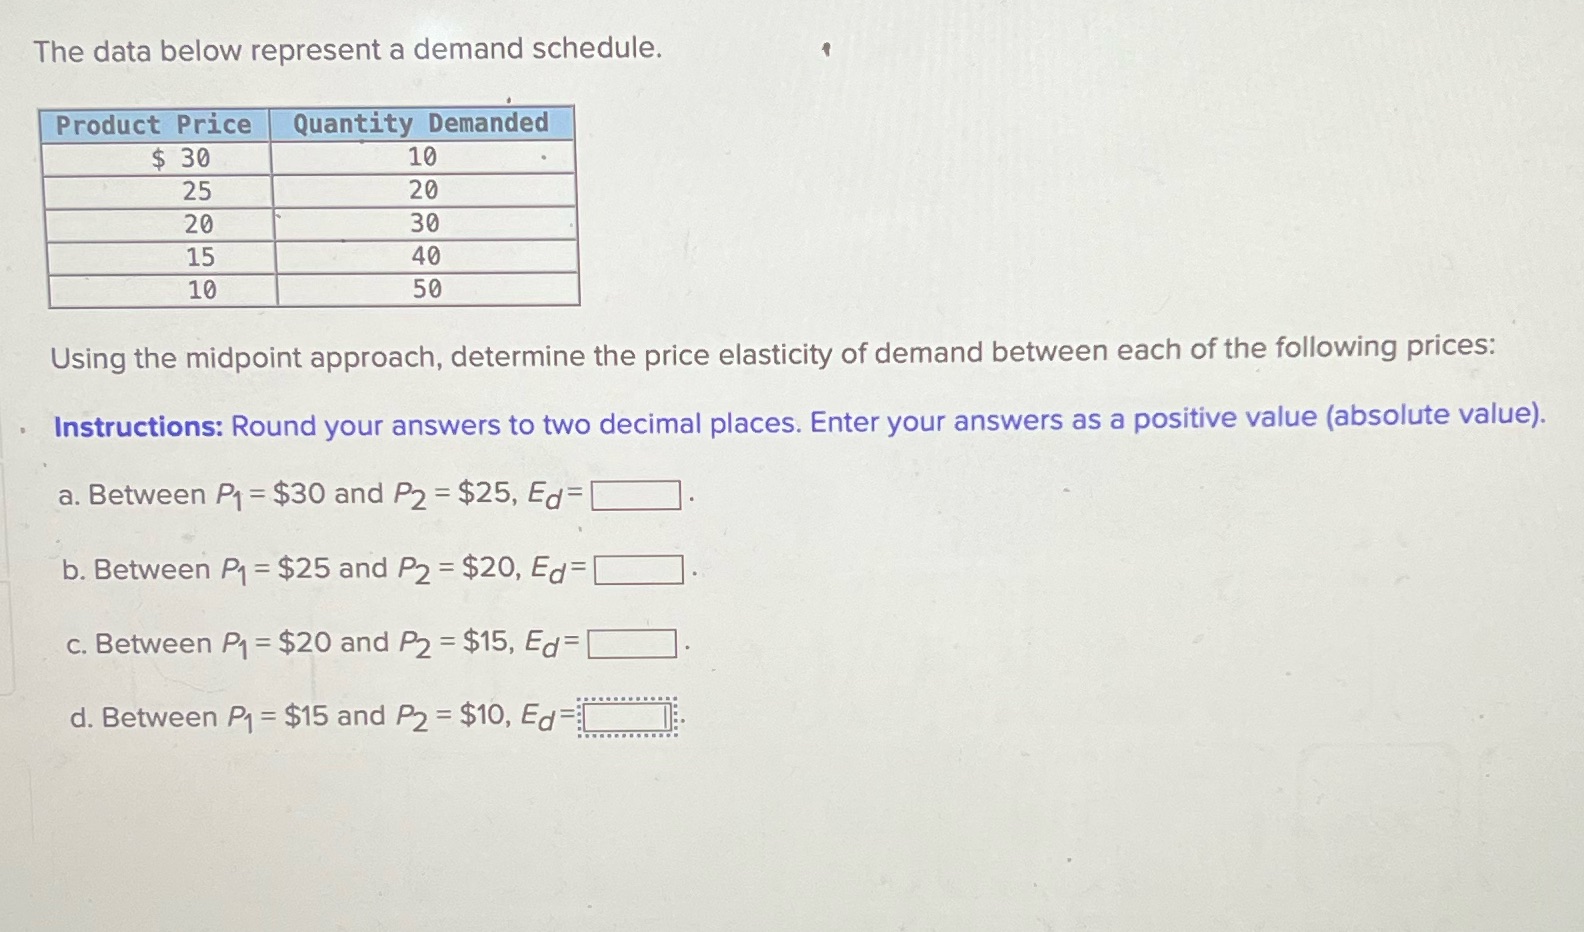
The data below represent a demand schedule. Product Price Quantity Demanded $ 30 10 25 20 20 30 15 40 10 50 Using the midpoint approach, determine the price elasticity of demand between each of the following prices: Instructions: Round your answers to two decimal places. Enter your answers as a positive value (absolute value). a. Between P1 = $30 and P2 = $25, Ed= b. Between P1 = $25 and P2 = $20, Ed= c. Between P1 = $20 and P2 = $15, Ed= d. Between P1 = $15 and P2 = $10, Ed=
Step by Step Solution
There are 3 Steps involved in it
1 Expert Approved Answer
Step: 1 Unlock

Question Has Been Solved by an Expert!
Get step-by-step solutions from verified subject matter experts
Step: 2 Unlock
Step: 3 Unlock