

Question: The data below represent expected returns and standard deviations estimated for a JP Morgan Emerging Market Bond ETF and an ETF indexed to the MSCI
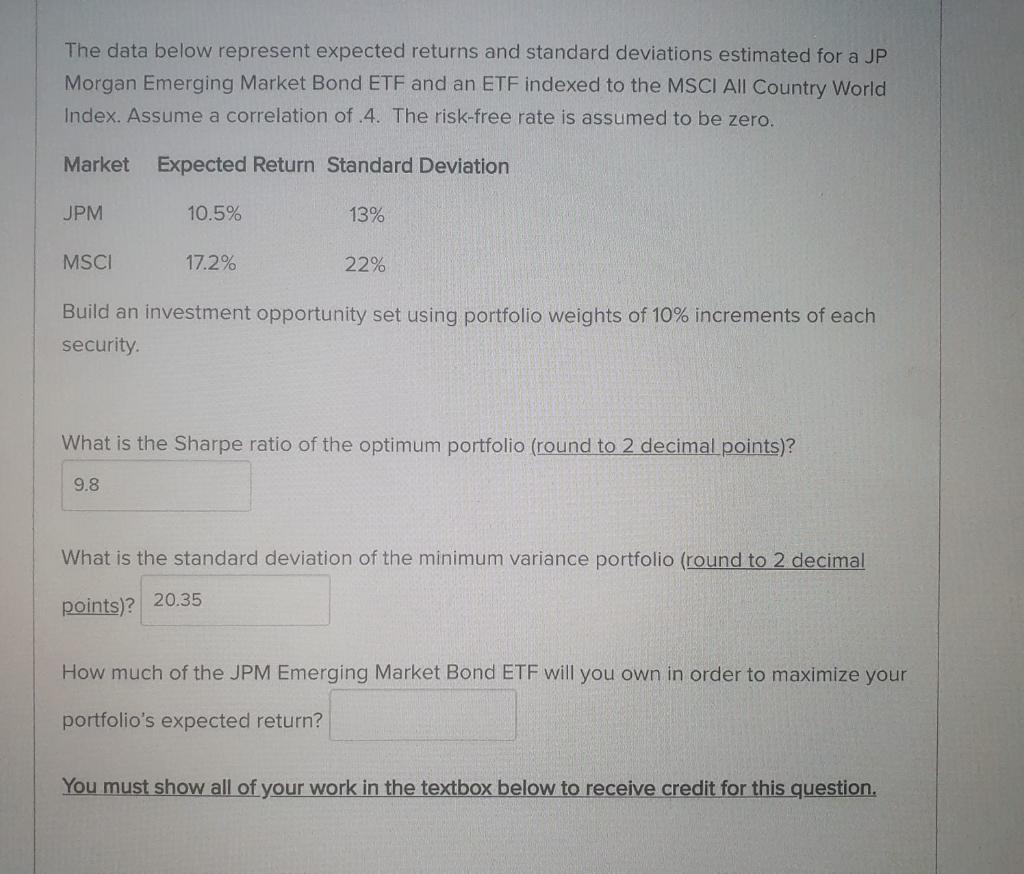
The data below represent expected returns and standard deviations estimated for a JP Morgan Emerging Market Bond ETF and an ETF indexed to the MSCI All Country World Index. Assume a correlation of .4. The risk-free rate is assumed to be zero. Market Expected Return Standard Deviation JPM 10.5% 13% MSCI 17.2% 22% Build an investment opportunity set using portfolio weights of 10% increments of each security. What is the Sharpe ratio of the optimum portfolio (round to 2 decimal points)? 9.8 What is the standard deviation of the minimum variance portfolio (round to 2 decimal 20.35 points)? How much of the JPM Emerging Market Bond ETF will you own in order to maximize your portfolio's expected return? You must show all of your work in the textbox below to receive credit for this question. The data below represent expected returns and standard deviations estimated for a JP Morgan Emerging Market Bond ETF and an ETF indexed to the MSCI All Country World Index. Assume a correlation of .4. The risk-free rate is assumed to be zero. Market Expected Return Standard Deviation JPM 10.5% 13% MSCI 17.2% 22% Build an investment opportunity set using portfolio weights of 10% increments of each security. What is the Sharpe ratio of the optimum portfolio (round to 2 decimal points)? 9.8 What is the standard deviation of the minimum variance portfolio (round to 2 decimal 20.35 points)? How much of the JPM Emerging Market Bond ETF will you own in order to maximize your portfolio's expected return? You must show all of your work in the textbox below to receive credit for this
Step by Step Solution
There are 3 Steps involved in it

Get step-by-step solutions from verified subject matter experts