

Question: The data below represent the age ( in years ) for 3 0 randomly selected students on campus this quarter. table [ [ 2
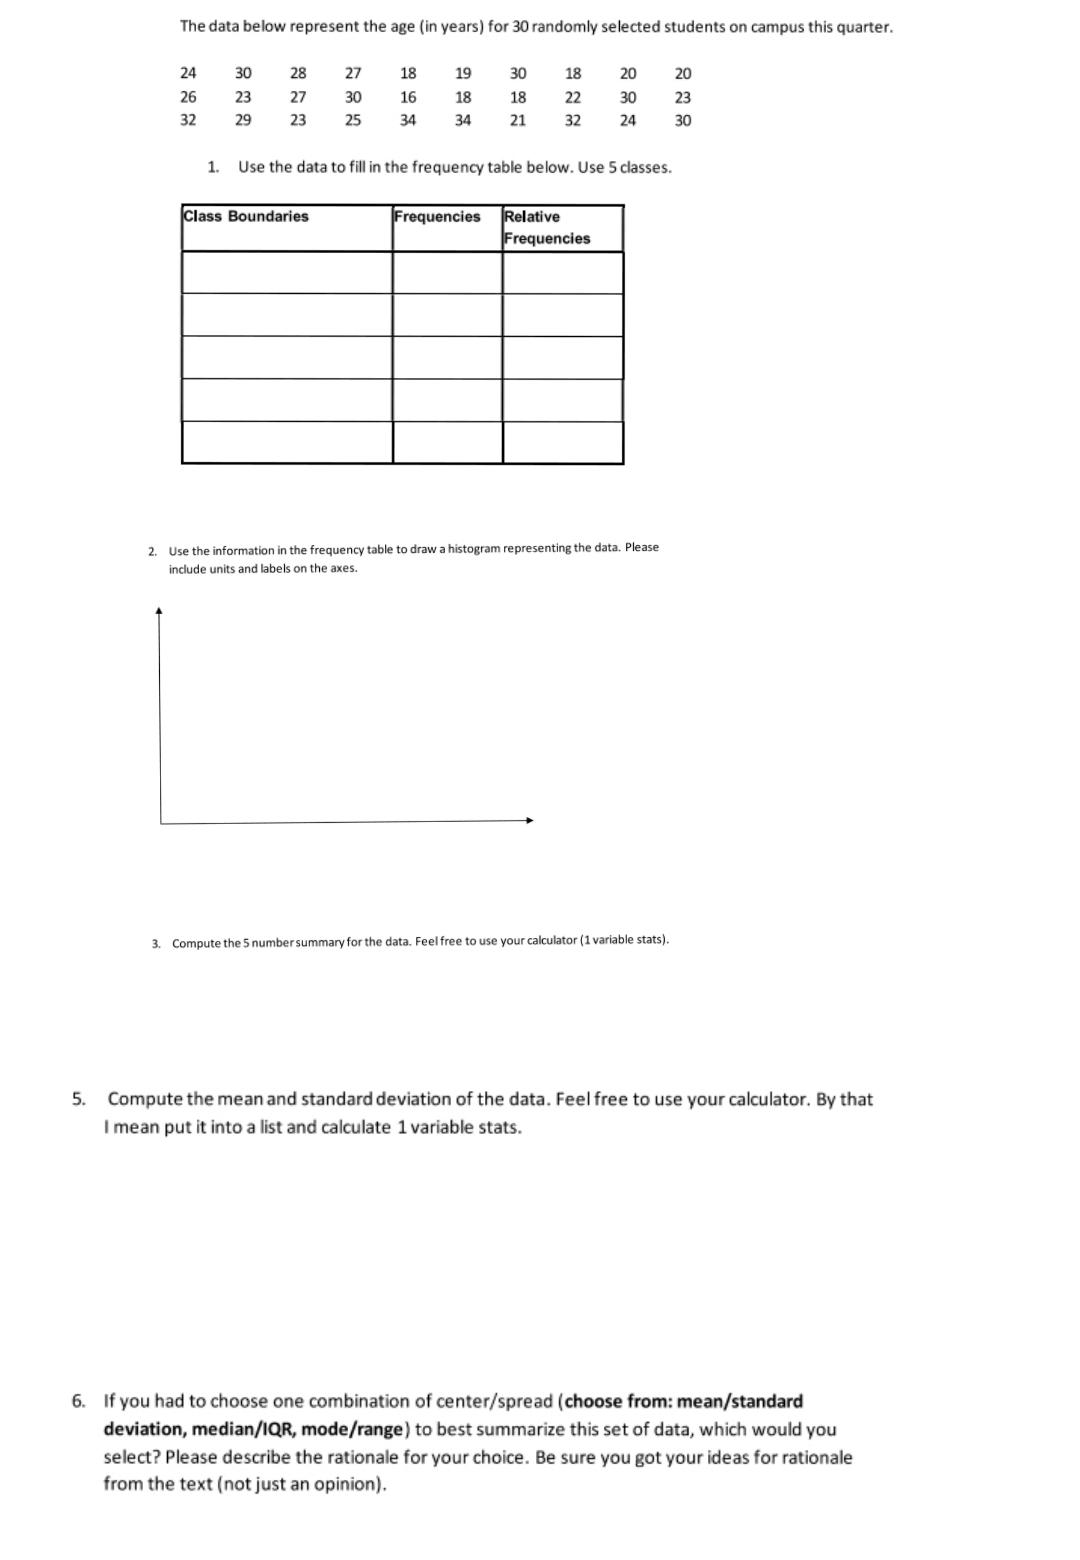
The data below represent the age in years for randomly selected students on campus this quarter.
table
Use the data to fill in the frequency table below. Use classes.
tableClass Boundaries,Frequencies,tableRelativeFrequencies
Use the information in the frequency table to draw a histogram representing the data. Please include units and labels on the axes.
Compute the number summary for the data. Feel free to use your calculator variable stats
Compute the mean and standard deviation of the data. Feel free to use your calculator. By that I mean put it into a list and calculate variable stats.
If you had to choose one combination of centerspread choose from: meanstandard deviation, medianIQR moderange to best summarize this set of data, which would you select? Please describe the rationale for your choice. Be sure you got your ideas for rationale from the text not just an opinion
Step by Step Solution
There are 3 Steps involved in it
1 Expert Approved Answer
Step: 1 Unlock

Question Has Been Solved by an Expert!
Get step-by-step solutions from verified subject matter experts
Step: 2 Unlock
Step: 3 Unlock