

Question: The data below(stored in Desktoplaptop) represent the hours per day spent by American desktop/laptop users from 2008 to 2014. a. Plot the time series. b.
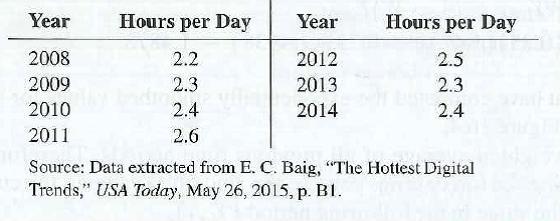
The data below(stored in Desktoplaptop) represent the hours per day spent by American desktop/laptop users from 2008 to 2014.
a. Plot the time series.
b. Fit a three-year moving average to the data and plot the results.
c. Using a smoothing coefficient of W = 0.50, exponentially smooth the series and plot the results.
d. What is your exponentially smoothed forecast for 2015?
e. Repeat (c) and (d), using W = 0.25.
f. Compare the results of (d) and (e).
g. What conclusions can you reach about desktop/laptop use by American users?
Year Hours per Day Year Hours per Day 2008 2.2 2012 2.5 2009 2.3 2013 2.3 2010 2.4 2014 2.4 2011 2.6 Source: Data extracted from E. C. Baig, "The Hottest Digital Trends," USA Today, May 26, 2015, p. BI.
Step by Step Solution
3.39 Rating (155 Votes )
There are 3 Steps involved in it

Get step-by-step solutions from verified subject matter experts