

Question: The data below represent the responses to two questions asked in a survey of 40 college students majoring in business: What is your gender? (M
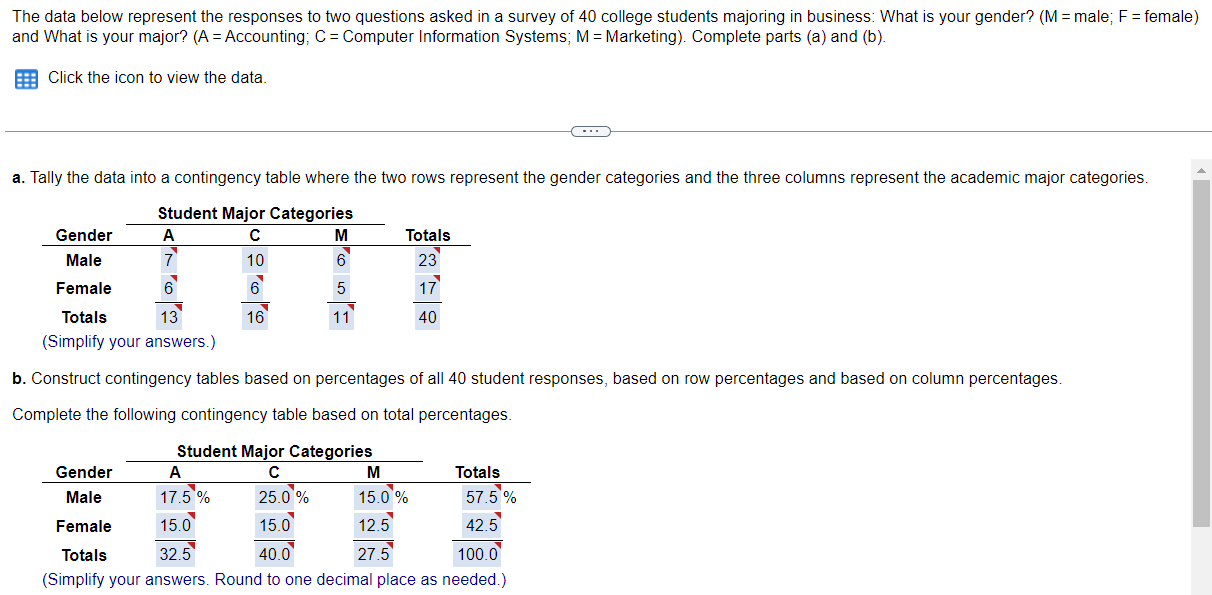
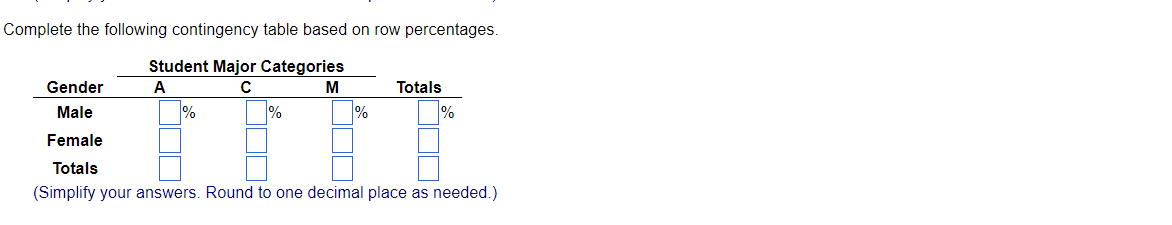
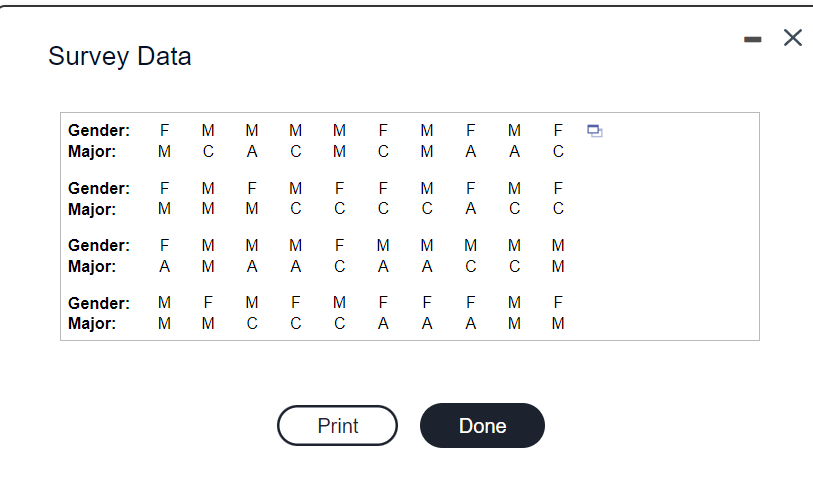
The data below represent the responses to two questions asked in a survey of 40 college students majoring in business: What is your gender? (M = male; F= female) and What is your major? (A = Accounting; C = Computer Information Systems, M = Marketing). Complete parts (a) and (b). Click the icon to view the data. .. a. Tally the data into a contingency table where the two rows represent the gender categories and the three columns represent the academic major categories. Student Major Categories Gender A M Male 10 6 Female 6 6 5 Totals 13 16 11 (Simplify your answers.) Totals 23 17 40 b. Construct contingency tables based on percentages of all 40 student responses, based on row percentages and based on column percentages. Complete the following contingency table based on total percentages. Student Major Categories Gender A M Totals Male 17.5% 25.0% 15.0 % 57.5 % Female 15.0 15.0 Totals 32.5 40.0 27.5 100.0 (Simplify your answers. Round to one decimal place as needed.) 12.5 42.5 Complete the following contingency table based on row percentages. Student Major Categories Gender M Totals Male % % % % Female Totals (Simplify your answers. Round to one decimal place as needed.) - Survey Data F M Gender: Major: M e M A M M M 33 F 33 M M F A M A C 0 Gender: Major: > F M 33 F M M E 0 F C F M F A 03 M F Gender: Major: DT M M M A M F C M M A M M 33 M M A 0 Gender: Major: M M 33 3 T F M 03 M F M F F F 33 M Print Done
Step by Step Solution
There are 3 Steps involved in it

Get step-by-step solutions from verified subject matter experts