

Question: The data below represent the scores students obtained on a Statistics exam. Summarize the scores by constructing a frequency distribution. Use five classes for your
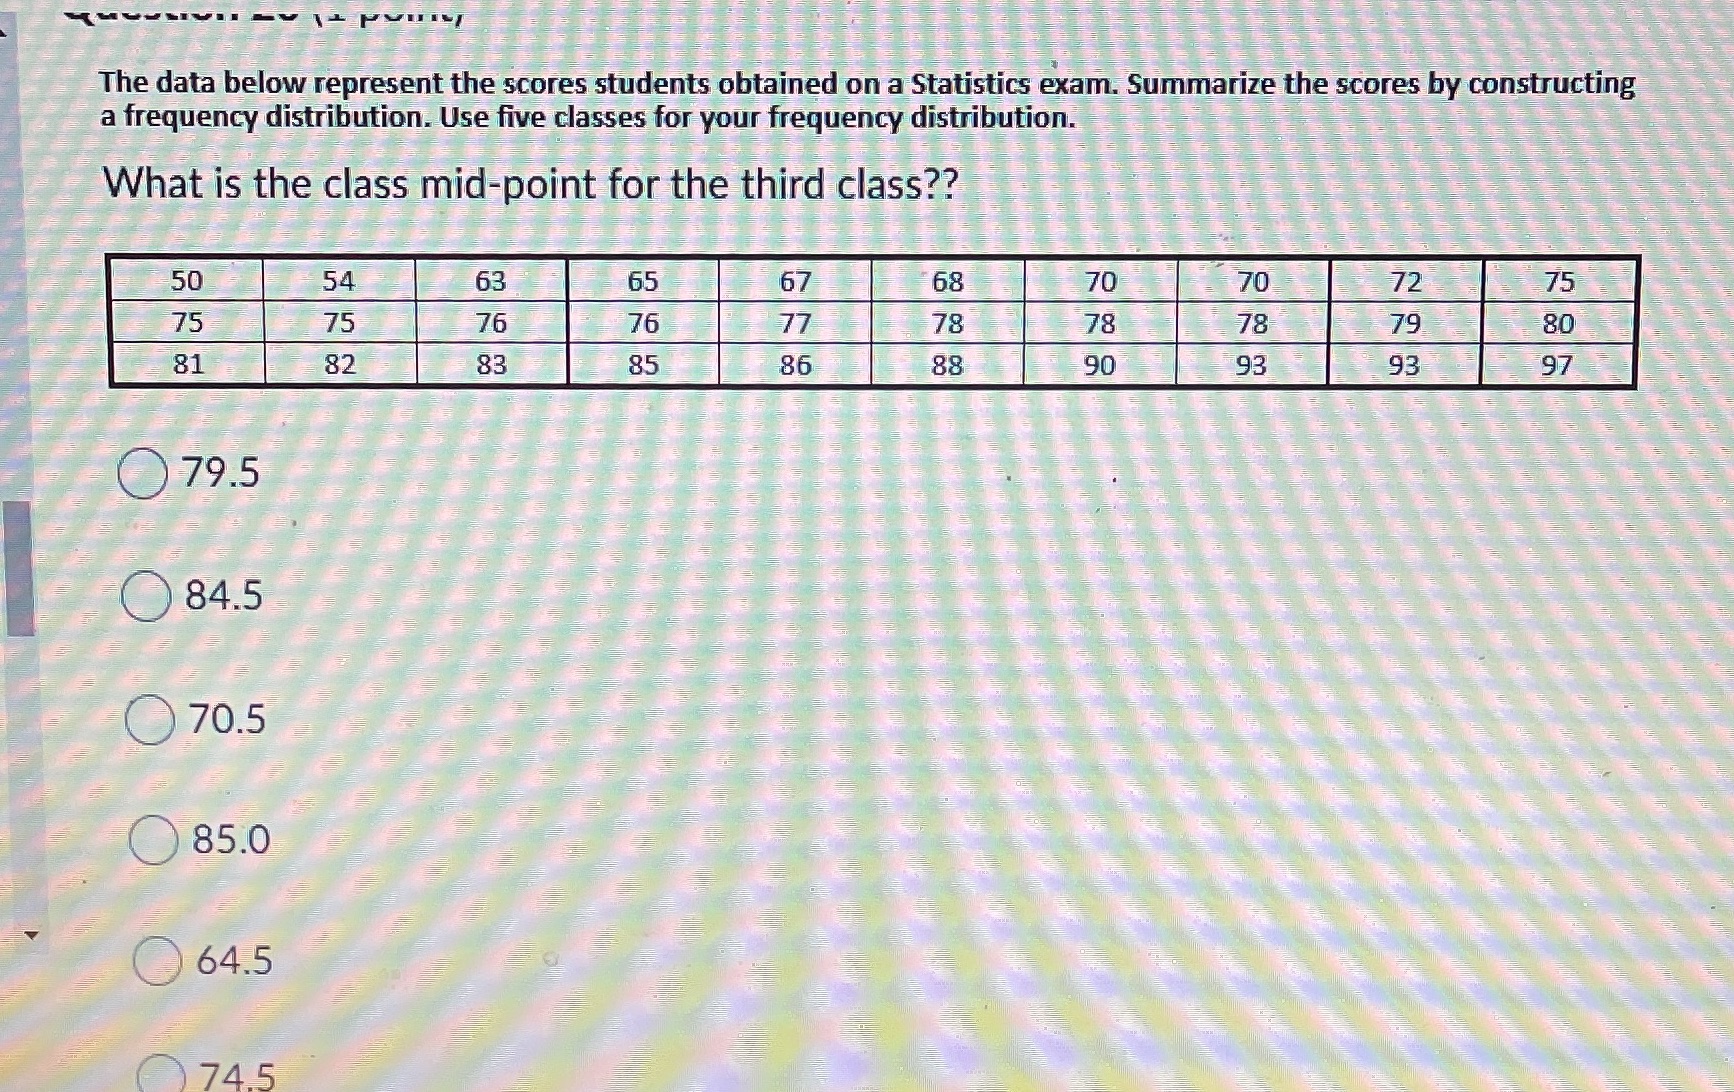
The data below represent the scores students obtained on a Statistics exam. Summarize the scores by constructing a frequency distribution. Use five classes for your frequency distribution. What is the class mid-point for the third class?? 50 54 63 65 67 68 70 70 72 75 75 75 76 76 77 78 78 78 79 80 81 82 83 85 86 88 90 93 93 97 79.5 84.5 70.5 85.0 64.5 745
Step by Step Solution
There are 3 Steps involved in it
1 Expert Approved Answer
Step: 1 Unlock

Question Has Been Solved by an Expert!
Get step-by-step solutions from verified subject matter experts
Step: 2 Unlock
Step: 3 Unlock