

Question: The data below represents a sample of daytime temperatures (in C) measured in Calgary, Alberta during the summer of 2018: 18 18 19 20 22
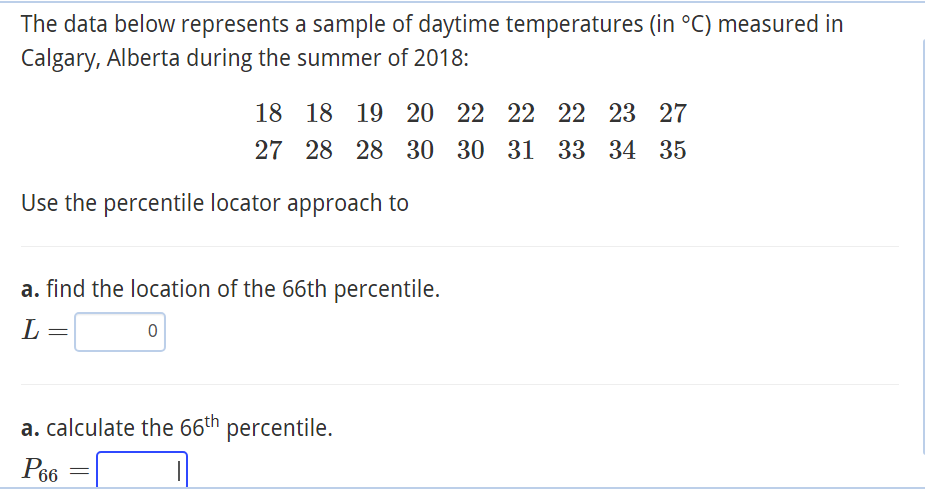

The data below represents a sample of daytime temperatures (in C) measured in Calgary, Alberta during the summer of 2018: 18 18 19 20 22 22 22 23 27 27 28 28 30 30 31 33 34 35 Use the percentile locator approach to a. find the location of the 66th percentile. L 0 a. calculate the 66th percentile. Po6 =
Step by Step Solution
There are 3 Steps involved in it
1 Expert Approved Answer
Step: 1 Unlock

Question Has Been Solved by an Expert!
Get step-by-step solutions from verified subject matter experts
Step: 2 Unlock
Step: 3 Unlock