

Question: The data below represents the data recorded after the hydrolysis of a substrate by an enzyme. Calculate Vmax and Km using a Lineweaver-Burk plot.
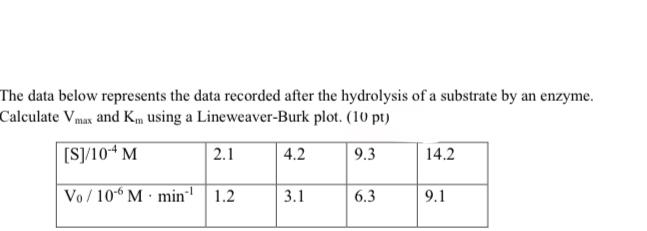
The data below represents the data recorded after the hydrolysis of a substrate by an enzyme. Calculate Vmax and Km using a Lineweaver-Burk plot. (10 pt) [S/104 M 4.2 9.3 14.2 2.1 Vo / 10 M min 1.2 3.1 6.3 9.1
Step by Step Solution
★★★★★
3.42 Rating (149 Votes )
There are 3 Steps involved in it
1 Expert Approved Answer
Step: 1 Unlock

Question Has Been Solved by an Expert!
Get step-by-step solutions from verified subject matter experts
Step: 2 Unlock
Step: 3 Unlock
Document Format (2 attachments)
60d452b07ff1a_227454.pdf
180 KBs PDF File
60d452b07ff1a_227454.docx
120 KBs Word File