

Question: The data below shows the sugar content in grams cf several brands of children's and adults' cereals. Create and interpret a 95% condence interval for
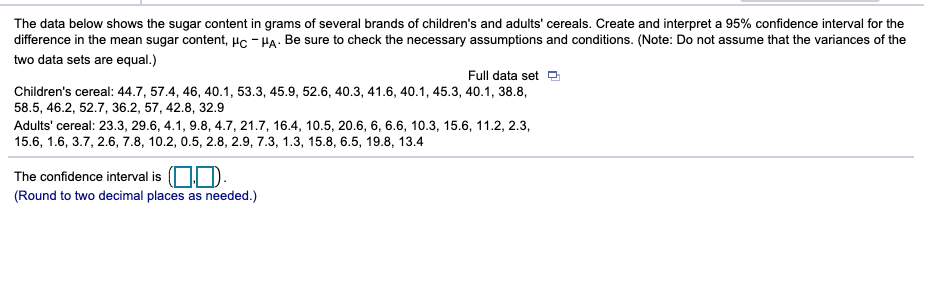
The data below shows the sugar content in grams cf several brands of children's and adults' cereals. Create and interpret a 95% condence interval for the difference in the mean sugar cuntent, lit: uA. Be sure to check the necessary assumptions and conditions. (Note: Do not assume that the variances of the two data sets are equal.) Full data set % Children's cereal: 443', 514,46, 40.1, 53.3, 45.9, 52.6, 40.3, 41.6, 40.1,45.3, 40.1, 33.3, 53.5, 46.2, 52136.2, 5?, 42.3, 32.9 Aduils' cereal: 23.3, 29.6, 4.1, 3.3, 43, 21}, 16.4, 10.5, 20.6, 3, 6.6, 10.3,15.6, 11.2, 2.3, 15.6, 1.6, 3}, 2.6, 7.3, 10.2, 0.5, 2.3, 23,13, 1.3, 15.3, 6.5, 19.3, 13.4 The condence interval is [D,D). {Round to two decimal places as needed.)
Step by Step Solution
There are 3 Steps involved in it

Get step-by-step solutions from verified subject matter experts