

Question: The data file for this problem contains the average hourly wage (multiplied by 100 ) for U. S. workers in the manufacturing industries by month
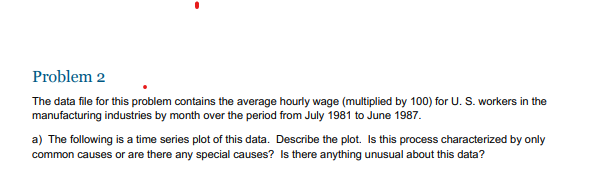
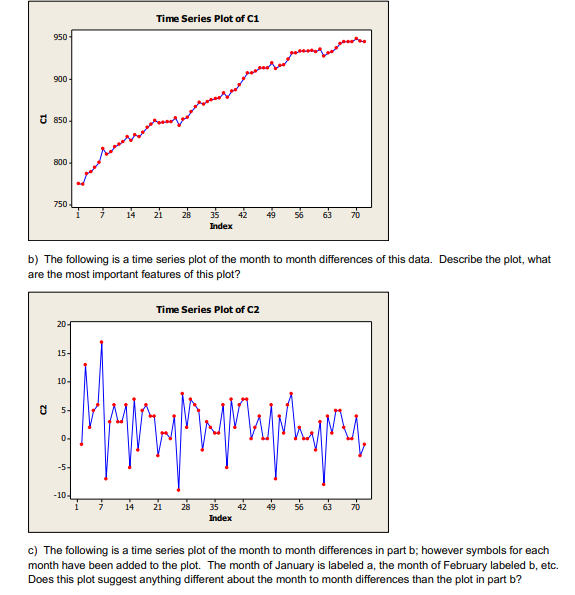
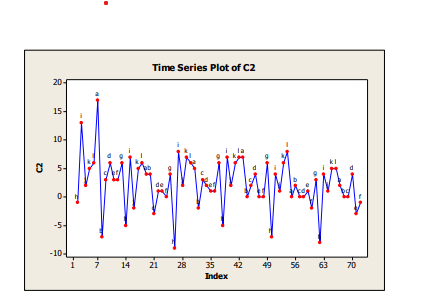
The data file for this problem contains the average hourly wage (multiplied by 100 ) for U. S. workers in the manufacturing industries by month over the period from July 1981 to June 1987. a) The following is a time series plot of this data. Describe the plot. Is this process characterized by only common causes or are there any special causes? Is there anything unusual about this data? b) The following is a time series plot of the month to month differences of this data. Describe the plot, what are the most important features of this plot? c) The following is a time series plot of the month to month differences in part b; however symbols for each month have been added to the plot. The month of January is labeled a, the month of February labeled b, etc. Does this plot suggest anything different about the month to month differences than the plot in part b
Step by Step Solution
There are 3 Steps involved in it

Get step-by-step solutions from verified subject matter experts