

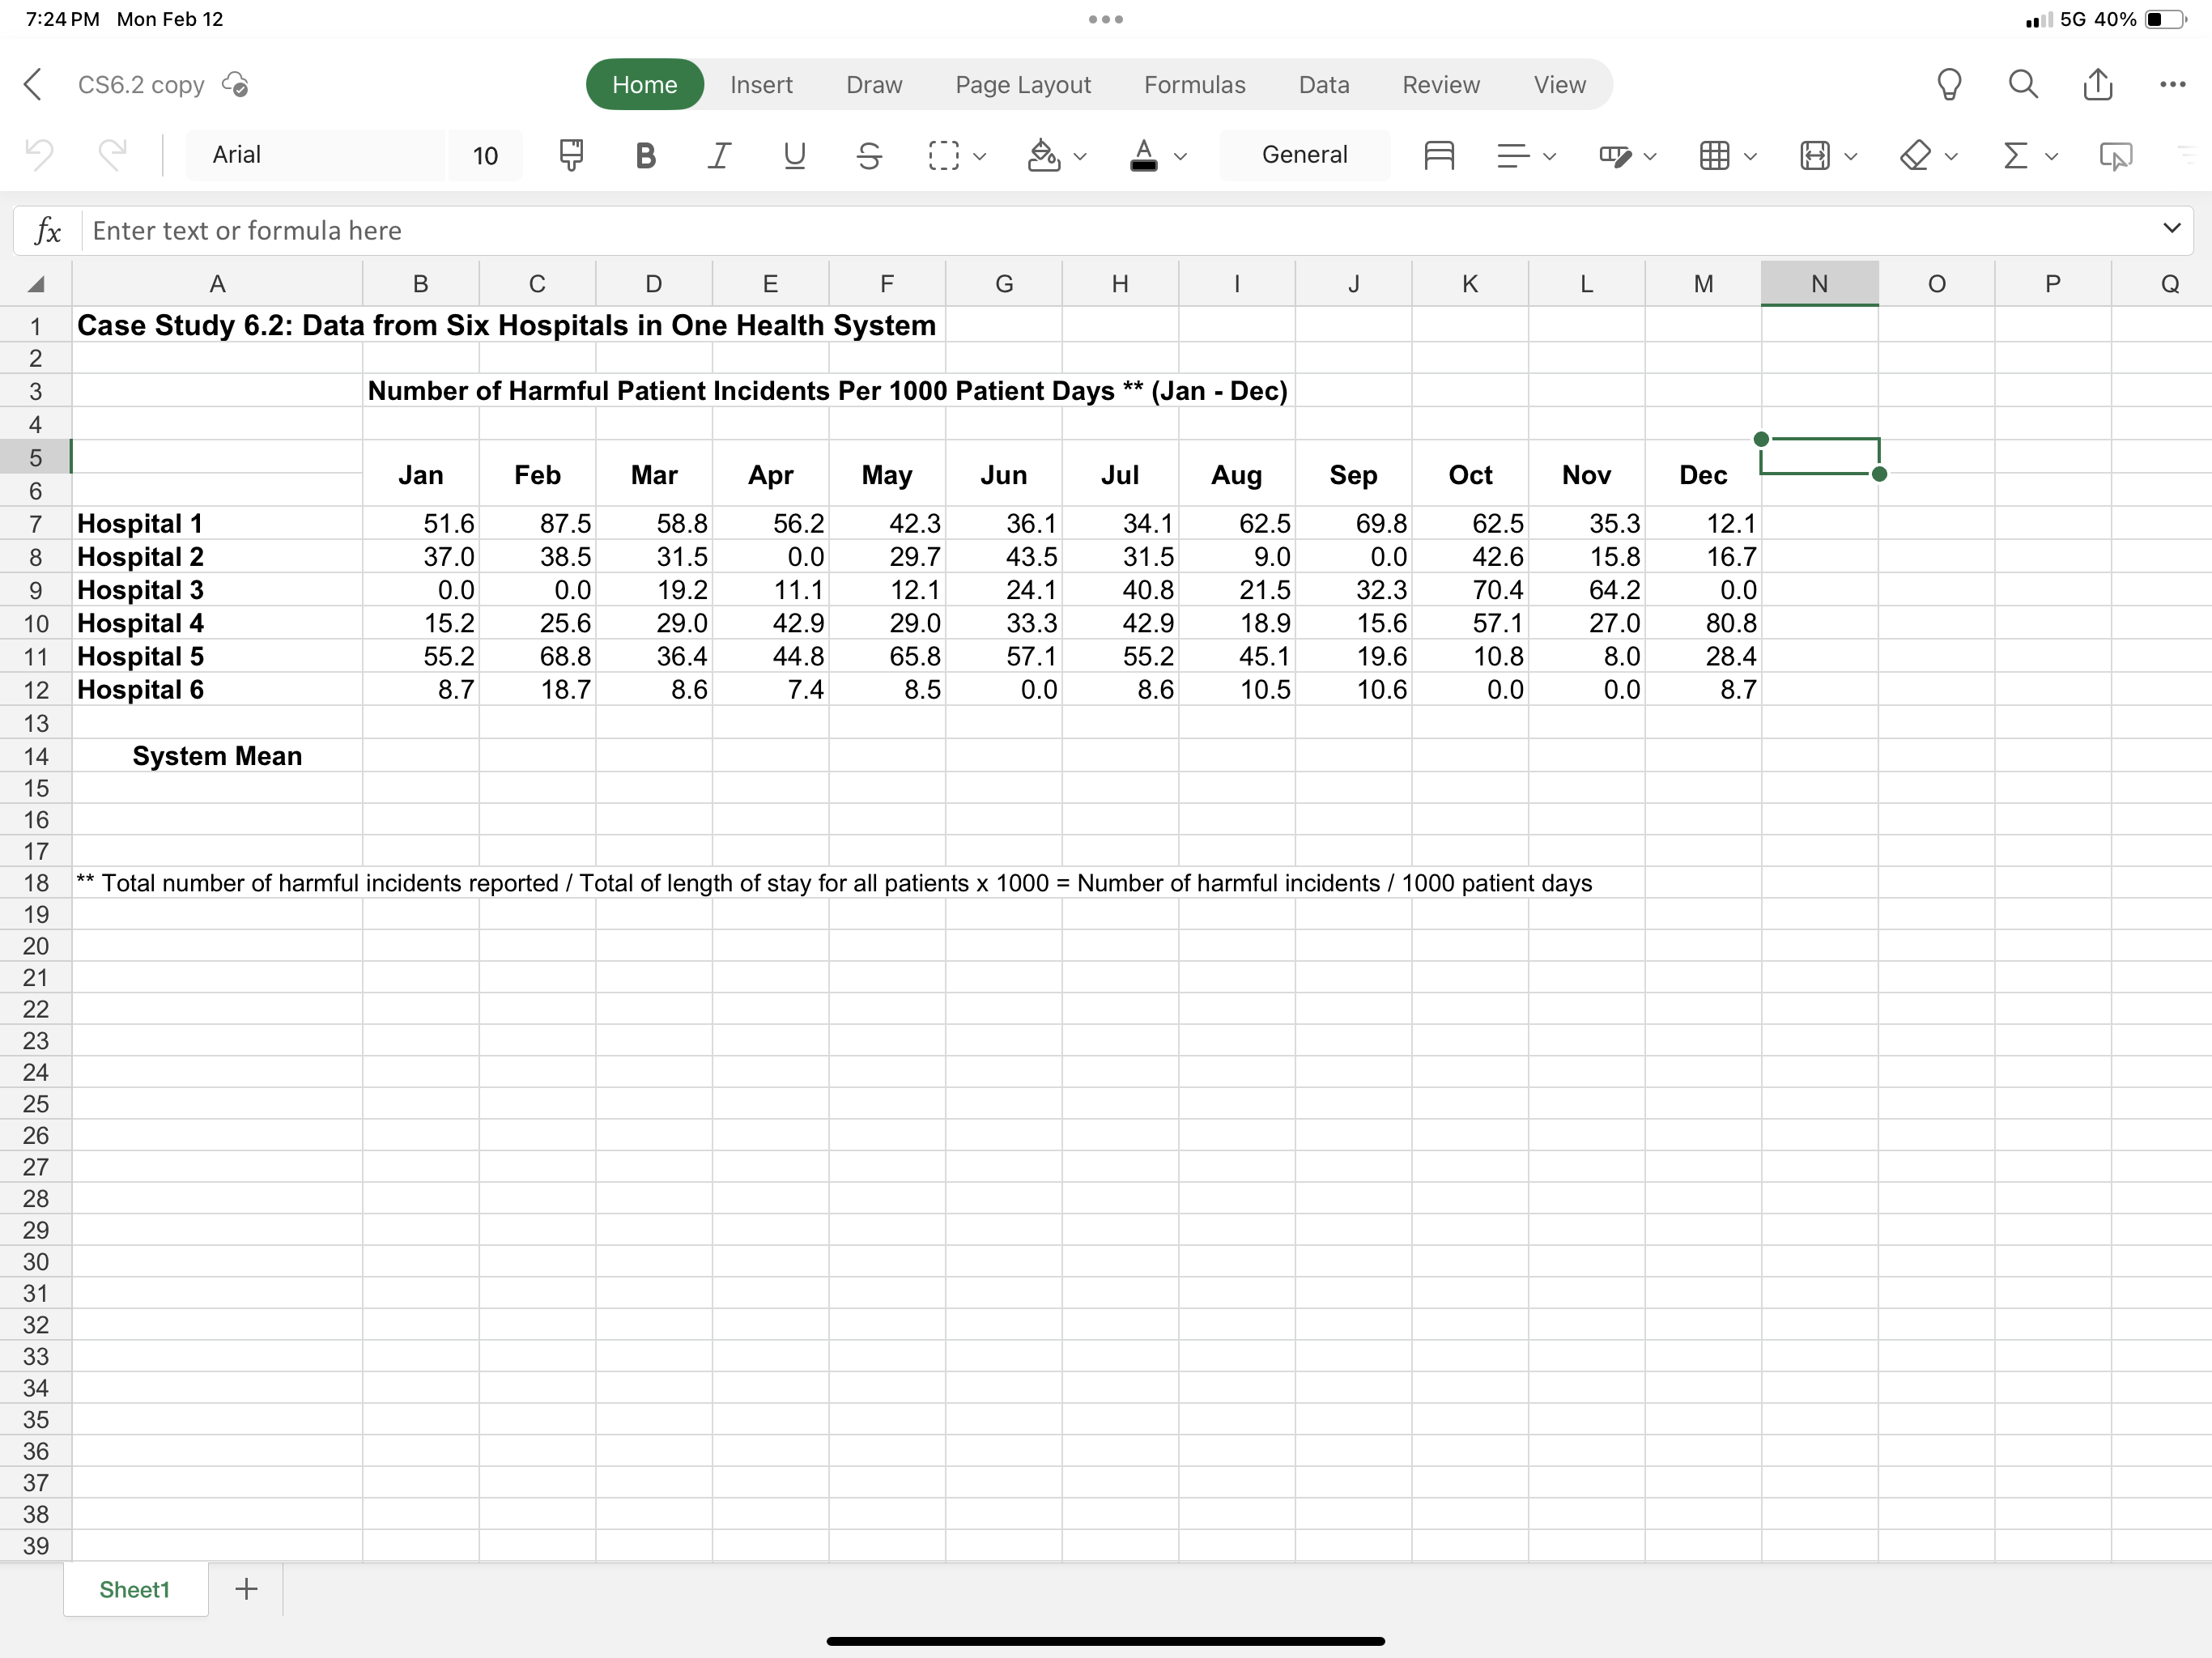
Question: The data file for this project contains 1 2 months ofdata from the six hospitals belonging to your health system. The file contains the monthly
The data file for this project contains months ofdata from the six hospitals belonging to your health system. The file contains the monthly number of harmfulpatient incidents per patient days for each hospital. Use this information to create one graph that provides the following inforamtion: for each hospital, report the quarterly mean rate of harmful incidients report the mean rate in each of the four quarters For the entire health system, report the quarterly mean rate of harmful incidents report the mean rate in each of the four quarters To create this graph, you'll first need to calcualte the quarterly mean incident rate at each hospital. Then calcualte the quarterly mean incident rate for the health system all hospitals commbined
Step by Step Solution
There are 3 Steps involved in it
1 Expert Approved Answer
Step: 1 Unlock

Question Has Been Solved by an Expert!
Get step-by-step solutions from verified subject matter experts
Step: 2 Unlock
Step: 3 Unlock