

Question: The data for a random sample of six paired observations are shown in the table. Population 1 Sample Population 2 Sample Pair Observation 2) c.
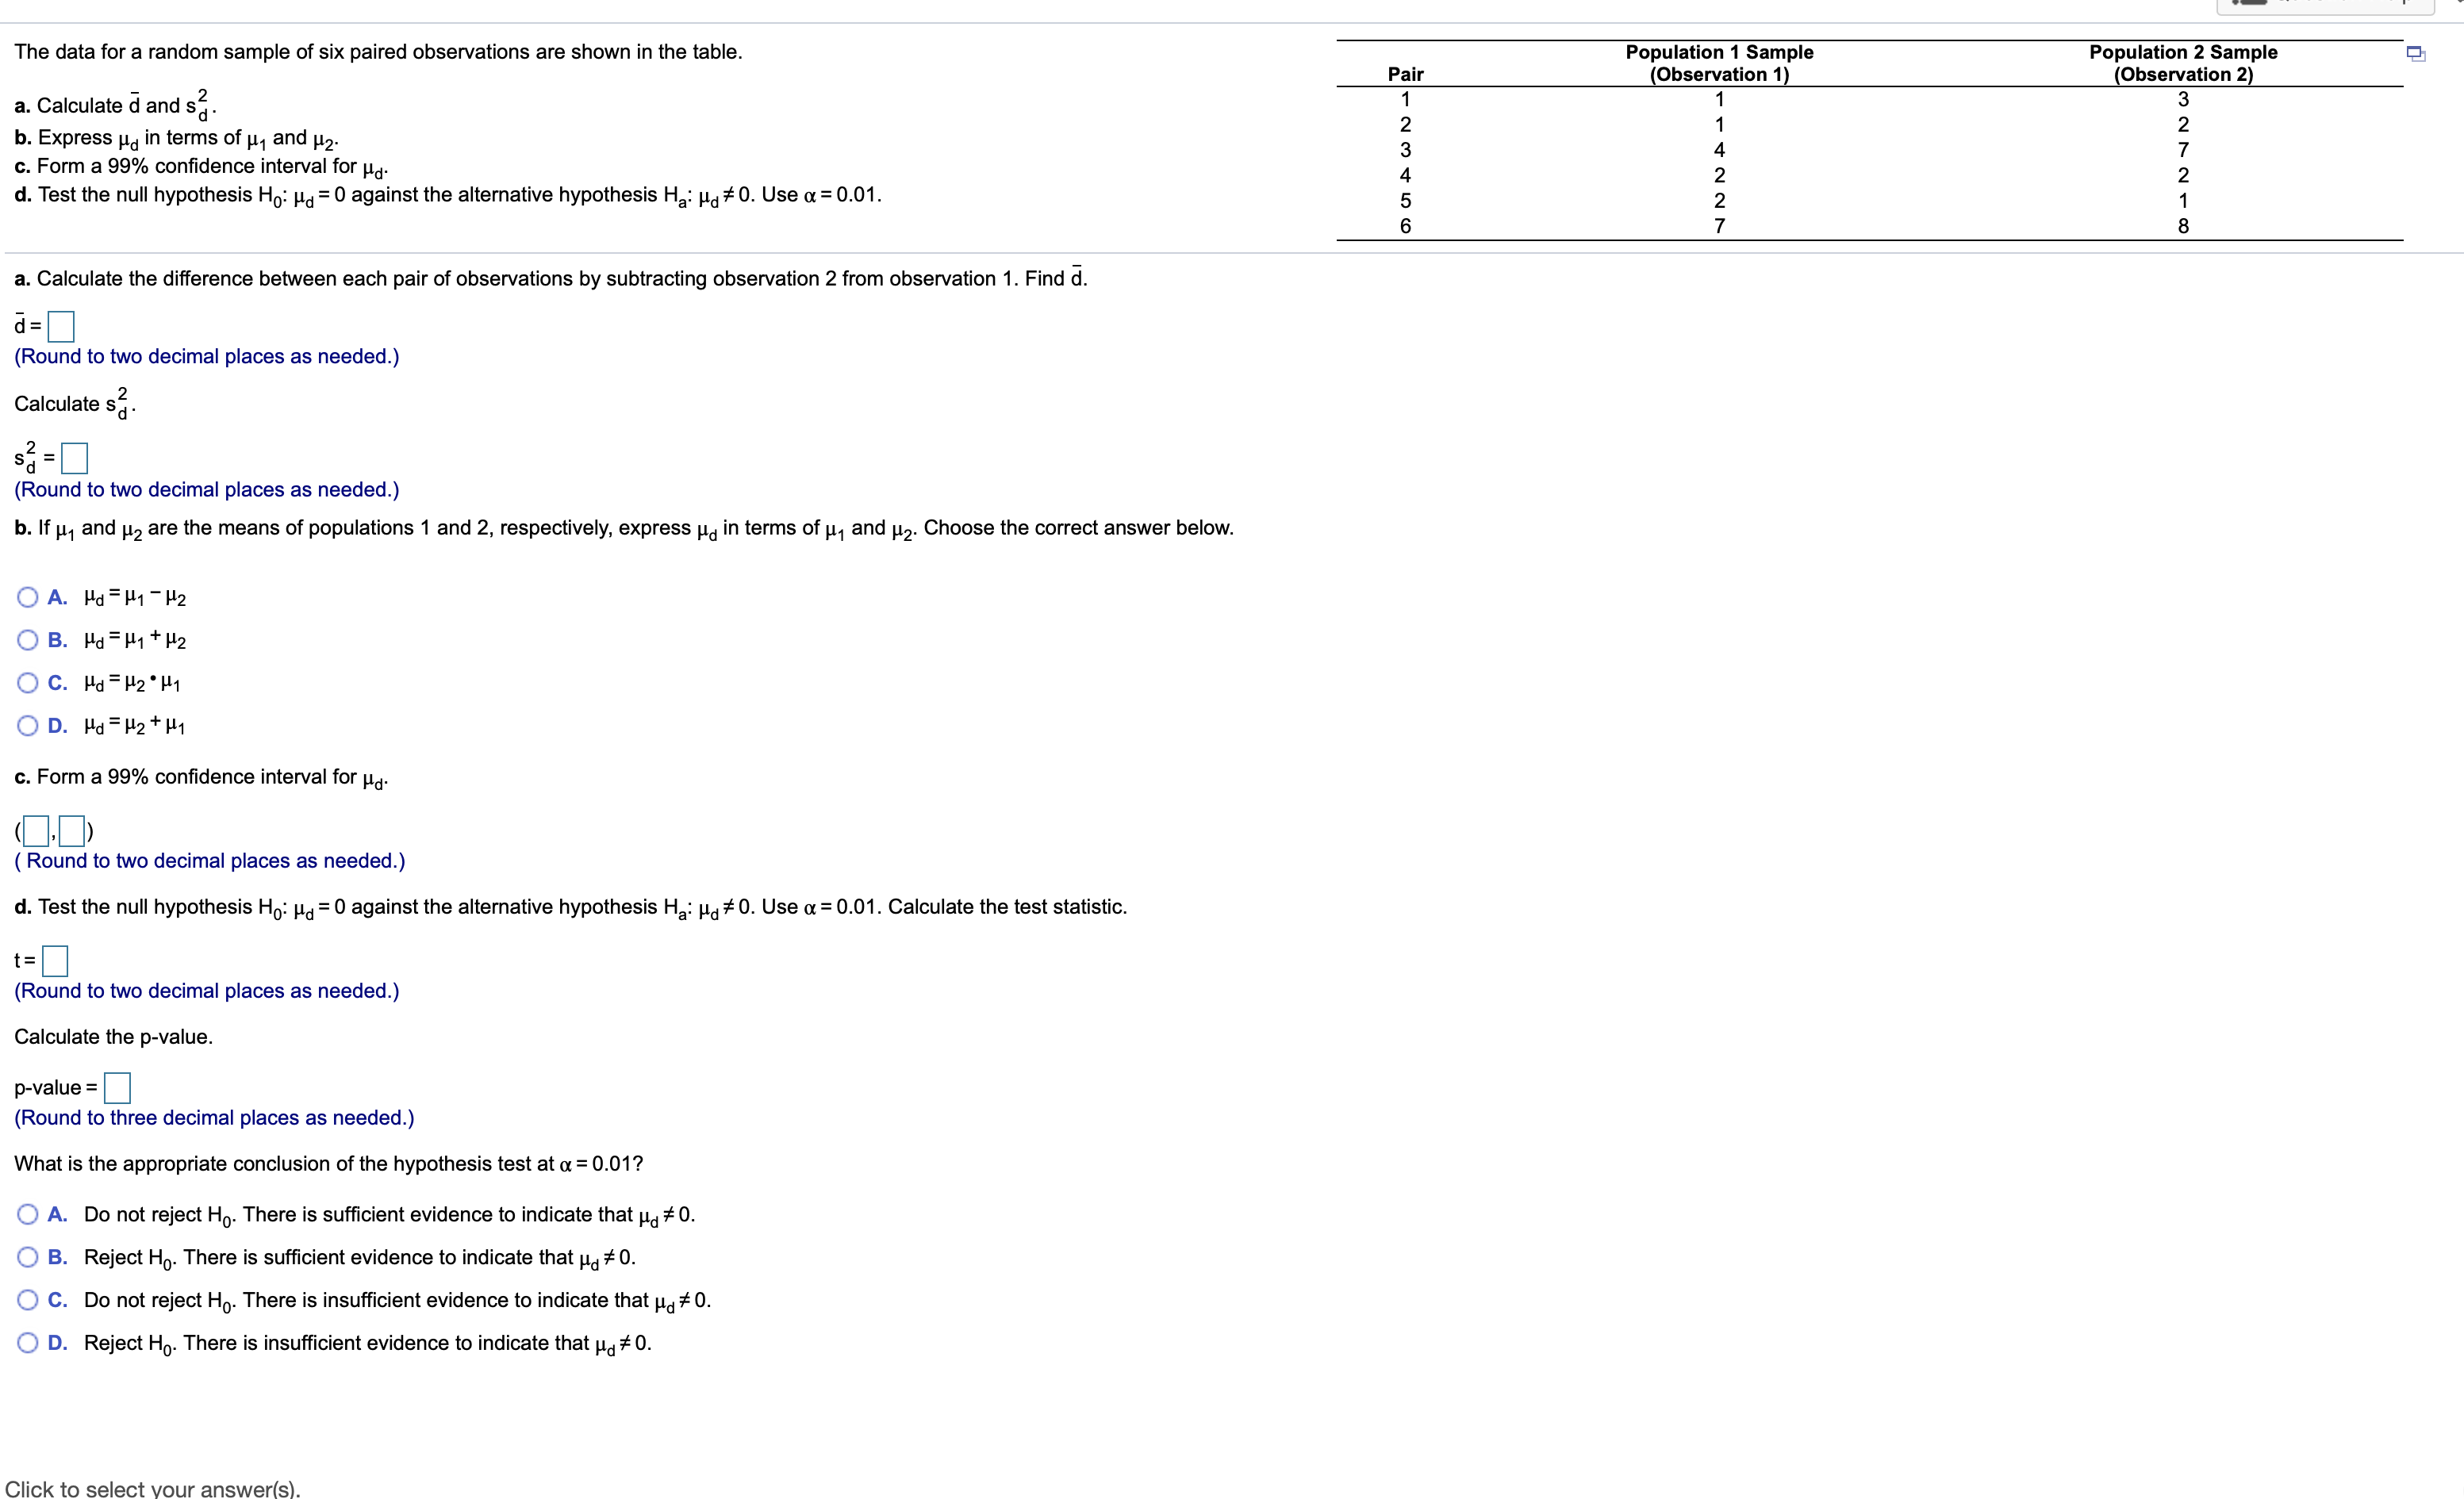
The data for a random sample of six paired observations are shown in the table. Population 1 Sample Population 2 Sample Pair Observation 2) c. Form a 99% confidence interval for Hd- d. Test the null hypothesis Ho: Ha = 0 against the alternative hypothesis Ha Ha # 0. Use a = 0.01. OUIAWN - (Observation 1) a. Calculate d and Sa. b. Express ud in terms of u, and #2- UNNA DO - NVNW a. Calculate the difference between each pair of observations by subtracting observation 2 from observation 1. Find d. d= (Round to two decimal places as needed.) Calculate s sa = 0 (Round to two decimal places as needed.) b. If u, and H2 are the means of populations 1 and 2, respectively, express ud in terms of u, and H2. Choose the correct answer below. O A. Ha = H1 - H2 O B. Ha = H1 + H2 O C. Ha = H2" M1 OD. Ha = H2 + H1 c. Form a 99% confidence interval for Hd- ( Round to two decimal places as needed.) d. Test the null hypothesis Ho: Ha = 0 against the alternative hypothesis Ha Ha # 0. Use a = 0.01. Calculate the test statistic. 1=] (Round to two decimal places as needed.) Calculate the p-value. p-value = (Round to three decimal places as needed.) What is the appropriate conclusion of the hypothesis test at a = 0.01? O A. Do not reject Ho. There is sufficient evidence to indicate that Ha # 0. O B. Reject Ho. There is sufficient evidence to indicate that Ha # 0. O C. Do not reject Ho. There is insufficient evidence to indicate that Ha # 0. O D. Reject Ho. There is insufficient evidence to indicate that Ha # 0
Step by Step Solution
There are 3 Steps involved in it

Get step-by-step solutions from verified subject matter experts