

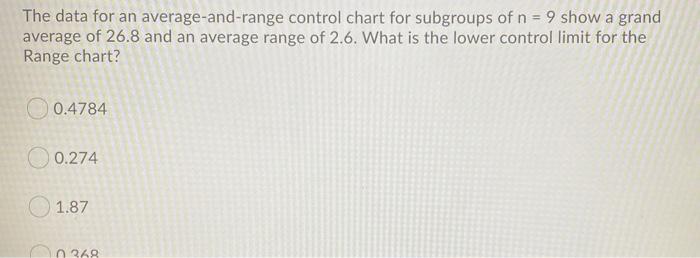
Question: The data for an average-and-range control chart for subgroups of n = 9 show a grand average of 26.8 and an average range of 2.6.
Step by Step Solution
There are 3 Steps involved in it
1 Expert Approved Answer
Step: 1 Unlock

Question Has Been Solved by an Expert!
Get step-by-step solutions from verified subject matter experts
Step: 2 Unlock
Step: 3 Unlock