

Question: The data given is the expected points for a football team with first down and 10 yards to go from various points on X y

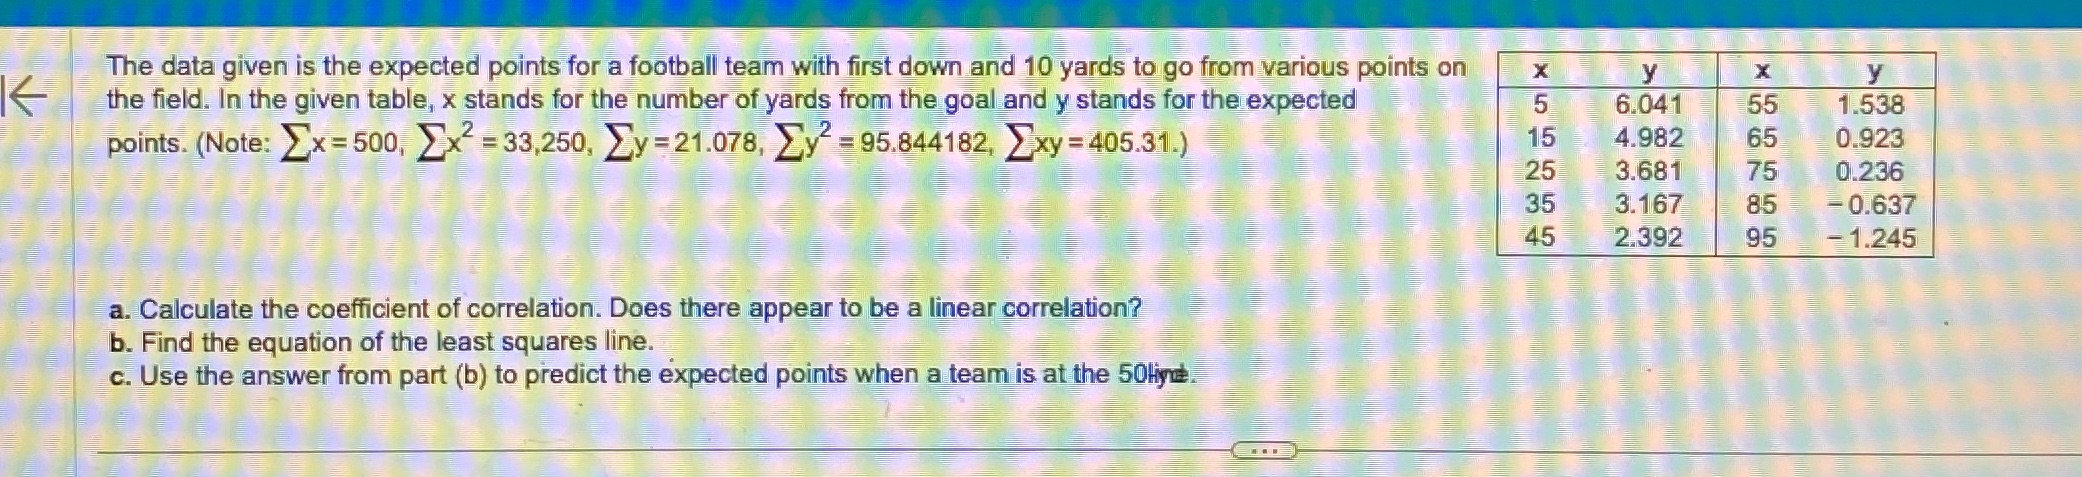
The data given is the expected points for a football team with first down and 10 yards to go from various points on X y X y the field. In the given table, x stands for the number of yards from the goal and y stands for the expected 5 6.041 55 1.538 points. (Note: _x=500, _x2 = 33,250, _y =21.078, _y? = 95.844182, _xy = 405.31.) 15 4.982 65 0.923 25 3.681 75 0.236 35 3.167 85 - 0.637 45 2.392 95 - 1.245 a. Calculate the coefficient of correlation. Does there appear to be a linear correlation? b. Find the equation of the least squares line. c. Use the answer from part (b) to predict the expected points when a team is at the 50line
Step by Step Solution
There are 3 Steps involved in it

Get step-by-step solutions from verified subject matter experts