

Question: The data given to the right includes data from 43 candies, and 8 of them are red. The company that makes the candy claims
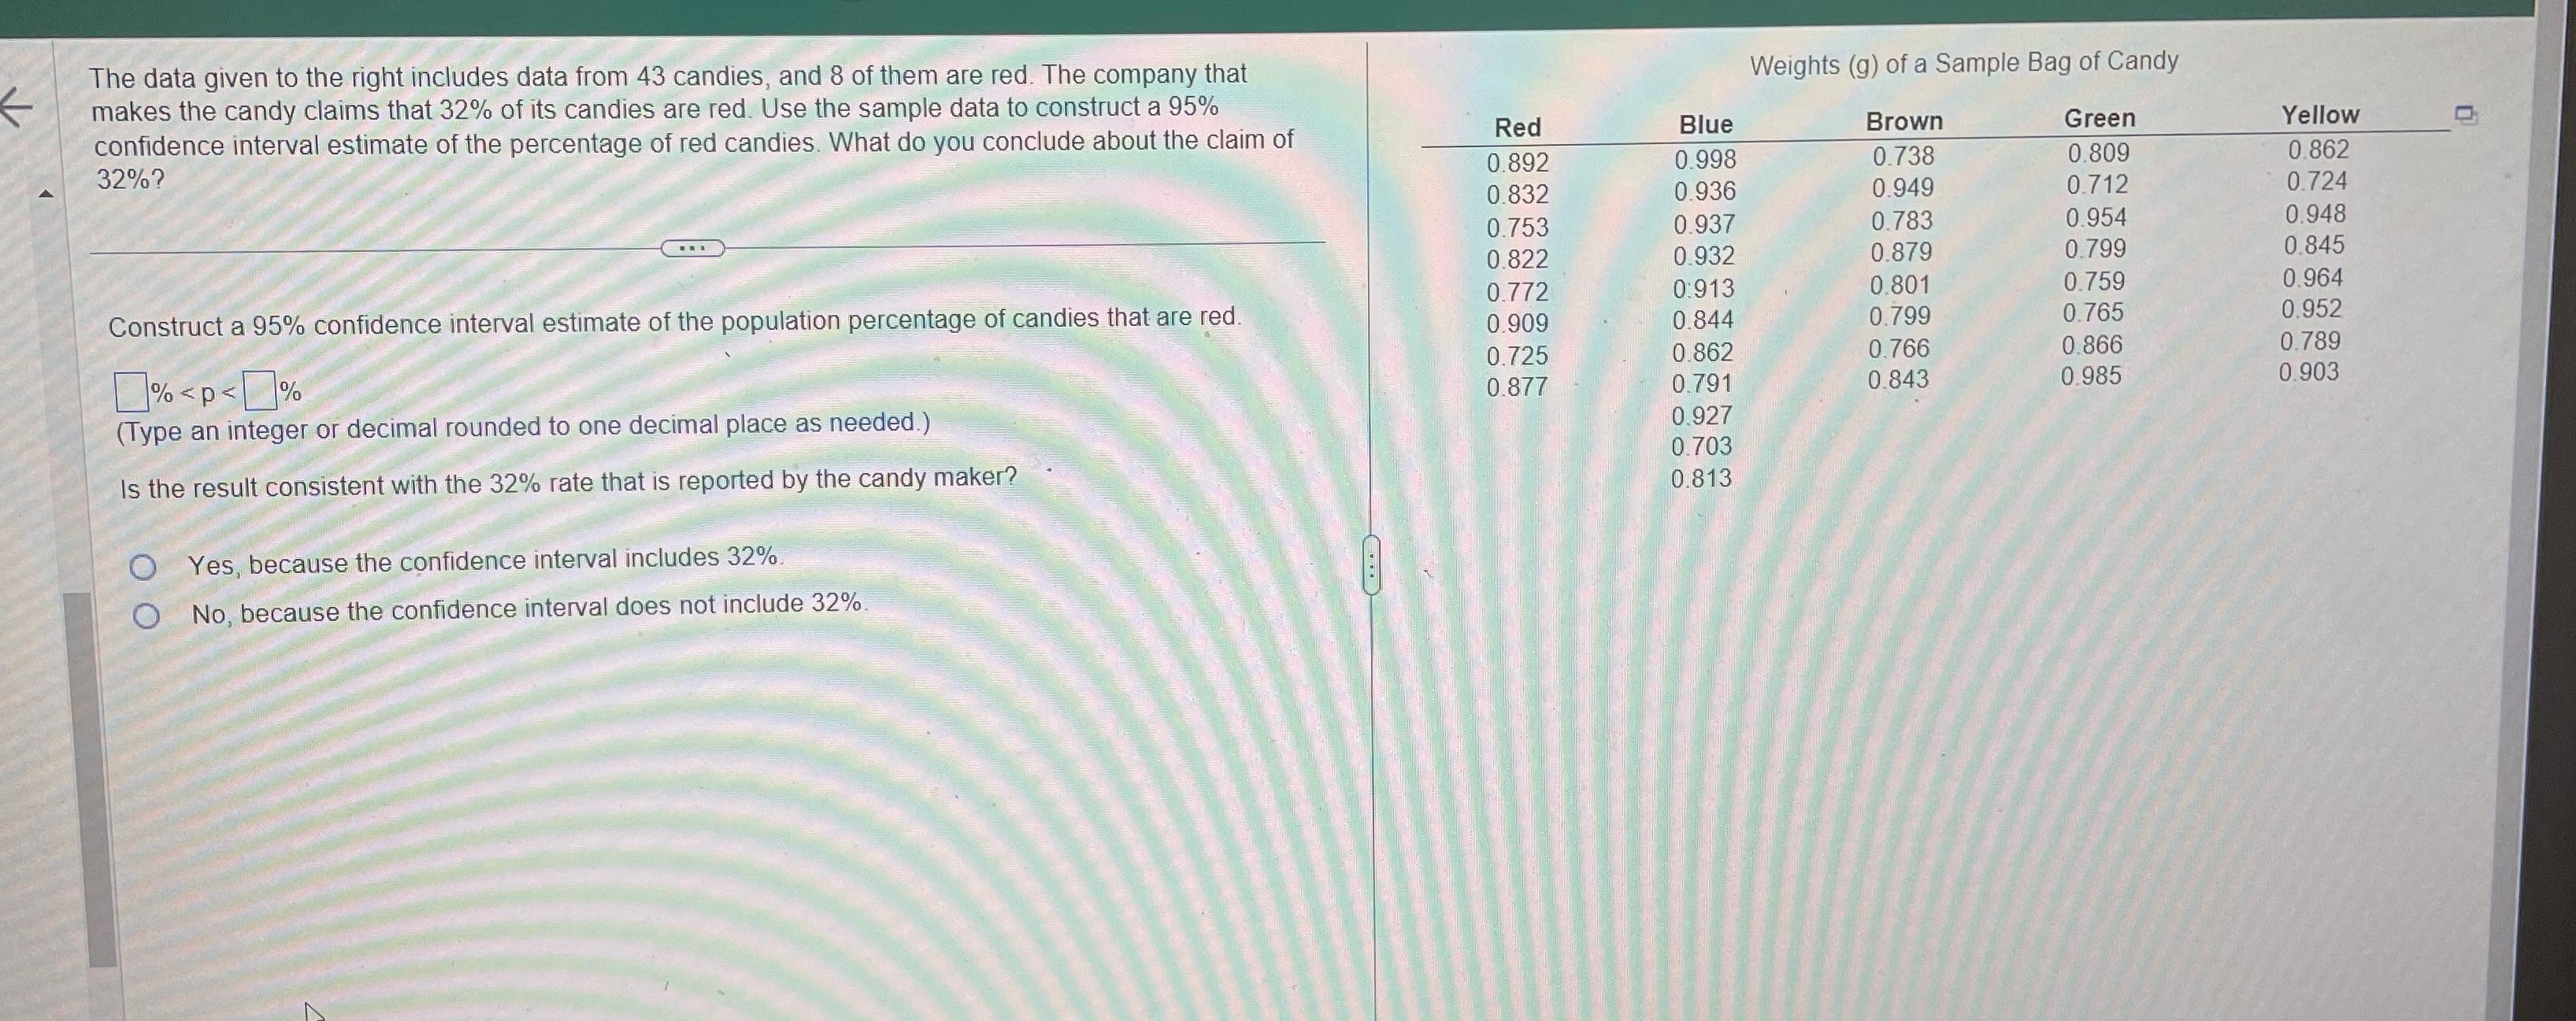
The data given to the right includes data from 43 candies, and 8 of them are red. The company that makes the candy claims that 32% of its candies are red. Use the sample data to construct a 95% confidence interval estimate of the percentage of red candies. What do you conclude about the claim of 32%? Weights (g) of a Sample Bag of Candy Red Blue Brown Green Yellow 0.892 0.998 0.738 0.809 0.862 0.832 0.936 0.949 0.712 0.724 0.753 0.937 0.783 0.954 0.948 0.822 0.932 0.879 0.799 0.845 0.772 0:913 0.801 0.759 0.964 Construct a 95% confidence interval estimate of the population percentage of candies that are red. 0.909 0.844 0.799 0.765 0.952 0.725 0.862 0.766 0.866 0.789 %
Step by Step Solution
There are 3 Steps involved in it

Get step-by-step solutions from verified subject matter experts