

Question: The data given to you in the following table (on the next page and the CSV file) contains the average monthly returns and standard deviations
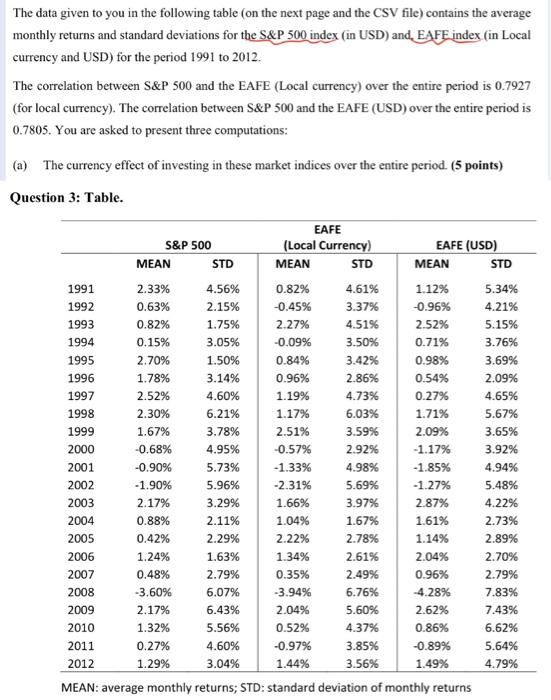
The data given to you in the following table (on the next page and the CSV file) contains the average monthly returns and standard deviations for the S&P 500 index (in USD) and EAFE index (in Local currency and USD) for the period 1991 to 2012. The correlation between S&P 500 and the EAFE (Local currency) over the entire period is 0.7927 (for local currency). The correlation between S&P 500 and the EAFE (USD) over the entire period is 0.7805. You are asked to present three computations: (a) The currency effect of investing in these market indices over the entire period. (5 points) Question 3: Table. EAFE S&P 500 (Local Currency) EAFE (USD) MEAN STD MEAN STD MEAN STD 1991 2.33% 4.56% 0.82% 4.61% 1.12% 5.34% 1992 0.63% 2.15% -0.45% 3.37% -0.96% 4.21% 1993 0.82% 1.75% 2.27% 4.51% 2.52% 5.15% 1994 0.15% 3.05% -0.09% 3.50% 0.71% 3.76% 1995 2.70% 1.50% 0.84% 3.42% 0.98% 3.69% 1996 1.78% 3.14% 0.96% 2.86% 0.54% 2.09% 1997 2.52% 4.60% 1.19% 4.73% 0.27% 4.65% 1998 2.30% 6.21% 1.17% 6.03% 1.71% 5.67% 1999 1.67% 3.78% 2.51% 3.59% 2.09% 3.65% 2000 -0.68% 4.95% -0.57% 2.92% -1.17% 3.92% 2001 -0.90% 5.73% -1.33% 4.98% -1.85% 4.94% 2002 -1.90% 5.96% -2.31% 5.69% -1.27% 5.48% 2003 2.17% 3.29% 1.66% 3.97% 2.87% 4.22% 2004 0.88% 2.11% 1.04% 1.67% 1.61% 2.73% 2005 0.42% 2.29% 2.22% 2.78% 1.14% 2.89% 2006 1.24% 1.63% 1.34% 2.61% 2.04% 2.70% 2007 0.48% 2.79% 0.35% 2.49% 0.96% 2.79% 2008 -3.60% 6.07% -3.94% 6.76% -4.28% 7.83% 2009 2.17% 6.43% 2.04% 5.60% 2.62% 7.43% 2010 1.32% 5.56% 0.52% 4.37% 0.86% 6.62% 2011 0.27% 4.60% -0.97% 3.85% -0.89% 5.64% 2012 1.29% 3.04% 1.44% 3.56% 1.49% 4.79% MEAN: average monthly returns; STD: standard deviation of monthly returns The data given to you in the following table (on the next page and the CSV file) contains the average monthly returns and standard deviations for the S&P 500 index (in USD) and EAFE index (in Local currency and USD) for the period 1991 to 2012. The correlation between S&P 500 and the EAFE (Local currency) over the entire period is 0.7927 (for local currency). The correlation between S&P 500 and the EAFE (USD) over the entire period is 0.7805. You are asked to present three computations: (a) The currency effect of investing in these market indices over the entire period. (5 points) Question 3: Table. EAFE S&P 500 (Local Currency) EAFE (USD) MEAN STD MEAN STD MEAN STD 1991 2.33% 4.56% 0.82% 4.61% 1.12% 5.34% 1992 0.63% 2.15% -0.45% 3.37% -0.96% 4.21% 1993 0.82% 1.75% 2.27% 4.51% 2.52% 5.15% 1994 0.15% 3.05% -0.09% 3.50% 0.71% 3.76% 1995 2.70% 1.50% 0.84% 3.42% 0.98% 3.69% 1996 1.78% 3.14% 0.96% 2.86% 0.54% 2.09% 1997 2.52% 4.60% 1.19% 4.73% 0.27% 4.65% 1998 2.30% 6.21% 1.17% 6.03% 1.71% 5.67% 1999 1.67% 3.78% 2.51% 3.59% 2.09% 3.65% 2000 -0.68% 4.95% -0.57% 2.92% -1.17% 3.92% 2001 -0.90% 5.73% -1.33% 4.98% -1.85% 4.94% 2002 -1.90% 5.96% -2.31% 5.69% -1.27% 5.48% 2003 2.17% 3.29% 1.66% 3.97% 2.87% 4.22% 2004 0.88% 2.11% 1.04% 1.67% 1.61% 2.73% 2005 0.42% 2.29% 2.22% 2.78% 1.14% 2.89% 2006 1.24% 1.63% 1.34% 2.61% 2.04% 2.70% 2007 0.48% 2.79% 0.35% 2.49% 0.96% 2.79% 2008 -3.60% 6.07% -3.94% 6.76% -4.28% 7.83% 2009 2.17% 6.43% 2.04% 5.60% 2.62% 7.43% 2010 1.32% 5.56% 0.52% 4.37% 0.86% 6.62% 2011 0.27% 4.60% -0.97% 3.85% -0.89% 5.64% 2012 1.29% 3.04% 1.44% 3.56% 1.49% 4.79% MEAN: average monthly returns; STD: standard deviation of monthly returns
Step by Step Solution
There are 3 Steps involved in it

Get step-by-step solutions from verified subject matter experts