

Question: The data has been collected in the Microsoft Excel Online file below. Open the spreadsheet and perform the required analysis to answer the questions below.
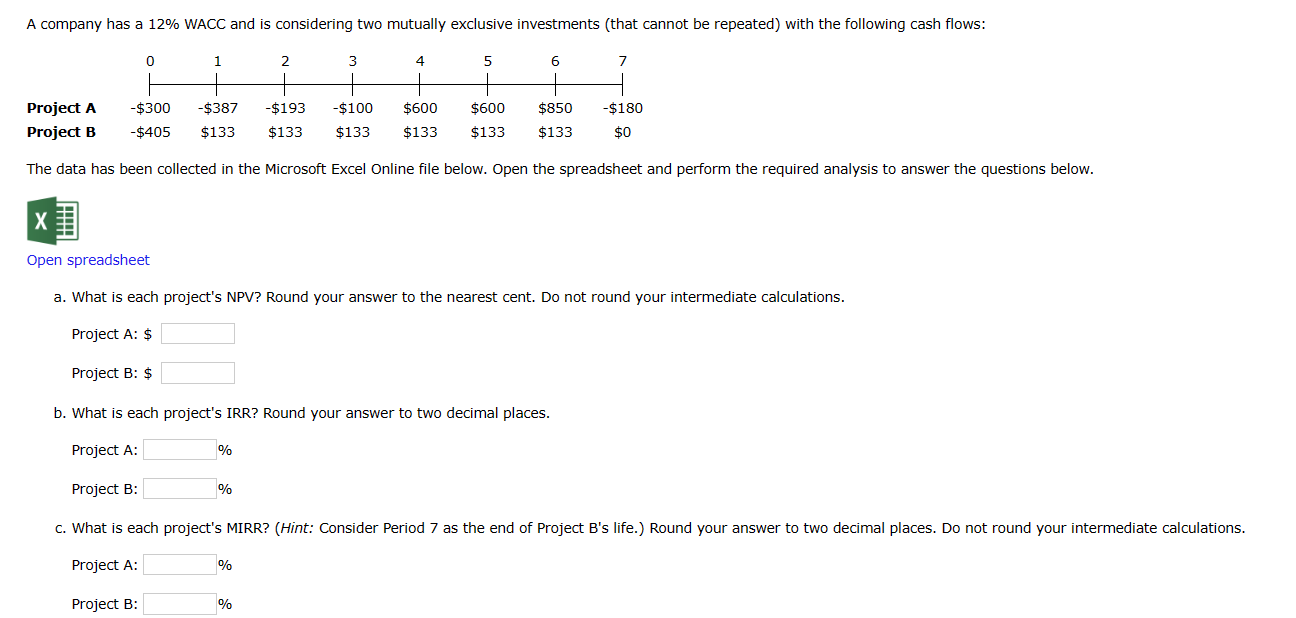
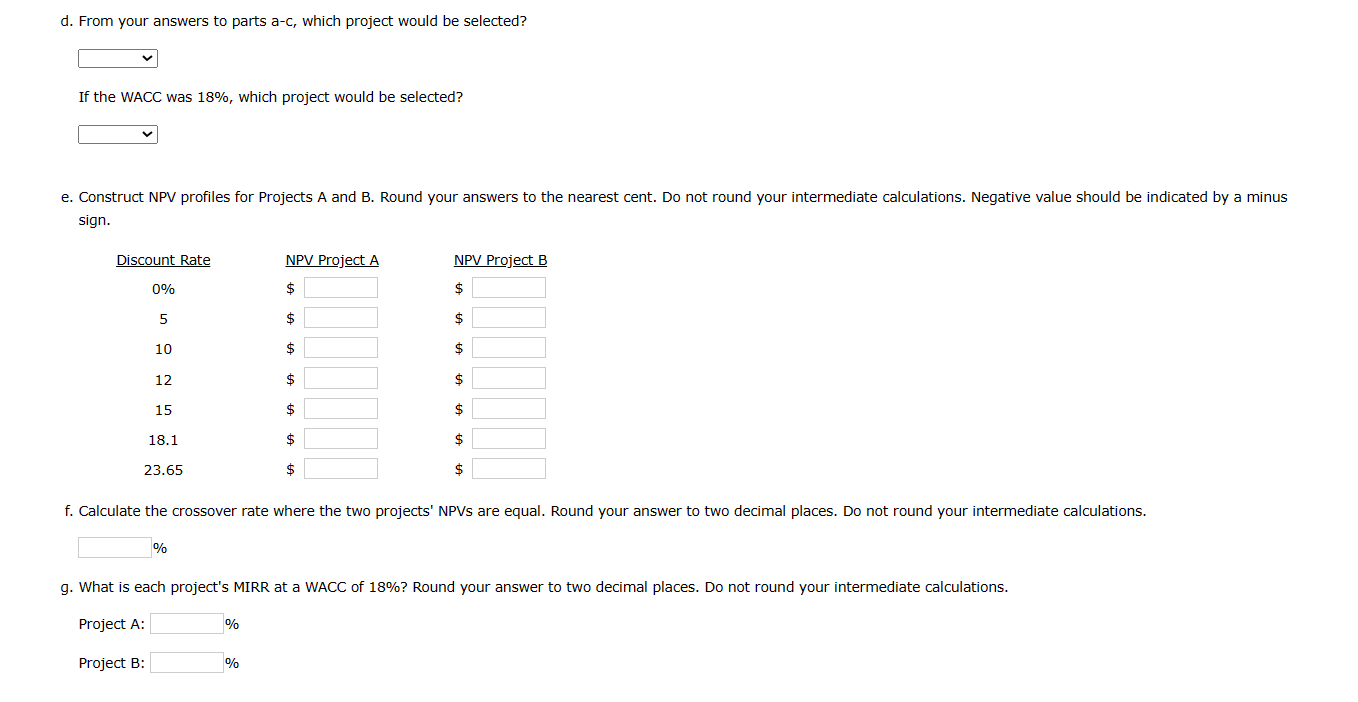
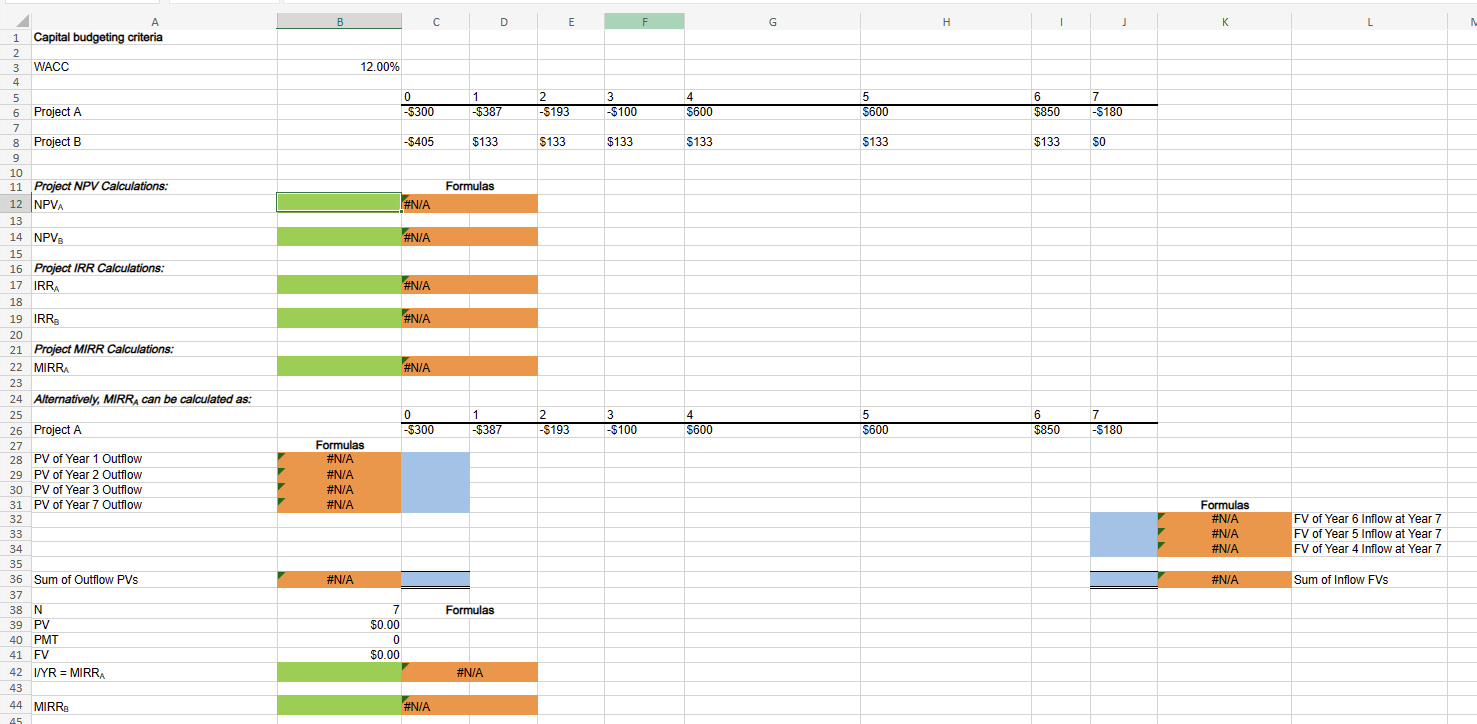
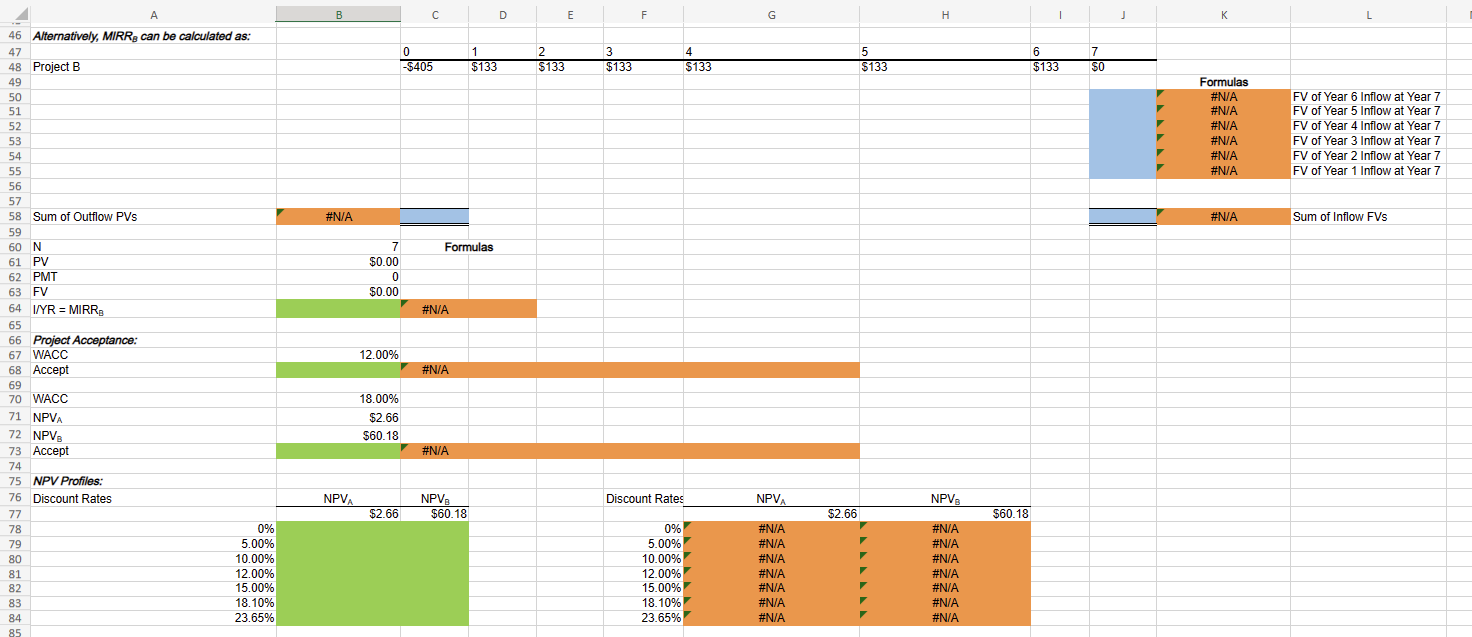
The data has been collected in the Microsoft Excel Online file below. Open the spreadsheet and perform the required analysis to answer the questions below. Open spreadsheet a. What is each project's NPV? Round your answer to the nearest cent. Do not round your intermediate calculations. Project A: \$ Project B: \$ b. What is each project's IRR? Round your answer to two decimal places. Project A: % Project B: % c. What is each project's MIRR? (Hint: Consider Period 7 as the end of Project B's life.) Round your answer to two decimal places. Do not round your intermediate calculations. Project A: % Project B: % d. From your answers to parts a-c, which project would be selected? If the WACC was 18%, which project would be selected? e. Construct NPV profiles for Projects A and B. Round your answers to the nearest cent. Do not round your intermediate calculations. Negative value shou sign. f. Calculate the crossover rate where the two projects' NPVs are equal. Round your answer to two decimal places. Do not round your intermediate calcula % g. What is each project's MIRR at a WACC of 18% ? Round your answer to two decimal places. Do not round your intermediate calculations. Project A: % Project B: % 1 1 Capital budgeting criteria WACC Project A Project B Project NPV Calculations: NPVA NPVB Project IRR Calculations: IRR A IRRB Project MIRR Calculations: MIRRA Alternatively, MIRR RA can be calculated as: Project A PV of Year 1 Outflow PV of Year 2 Outflow PV of Year 3 Outflow PV of Year 7 Outflow Sum of Outflow PVs N PV PMT FV I/YR=MIRRA MIRRB \begin{tabular}{lll} 0 & 1 & 2 \\ \hline$300 & $387 & - \end{tabular} 23 $1003 $6004 5 $600 $133 Formulas \#N/A \#N/A \#N/A \#N/A 2 51003 4 5 6 7 $300 $387 Formulas \#N/A \#N/A \#N/A \#N/A Formulas \#N/A \#N/A \#N/A \#N/A FV of Year 6 Inflow at Year 7 FV of Year 5 Inflow at Year 7 FV of Year 4 Inflow at Year 7 Sum of Inflow FVs
Step by Step Solution
There are 3 Steps involved in it

Get step-by-step solutions from verified subject matter experts