

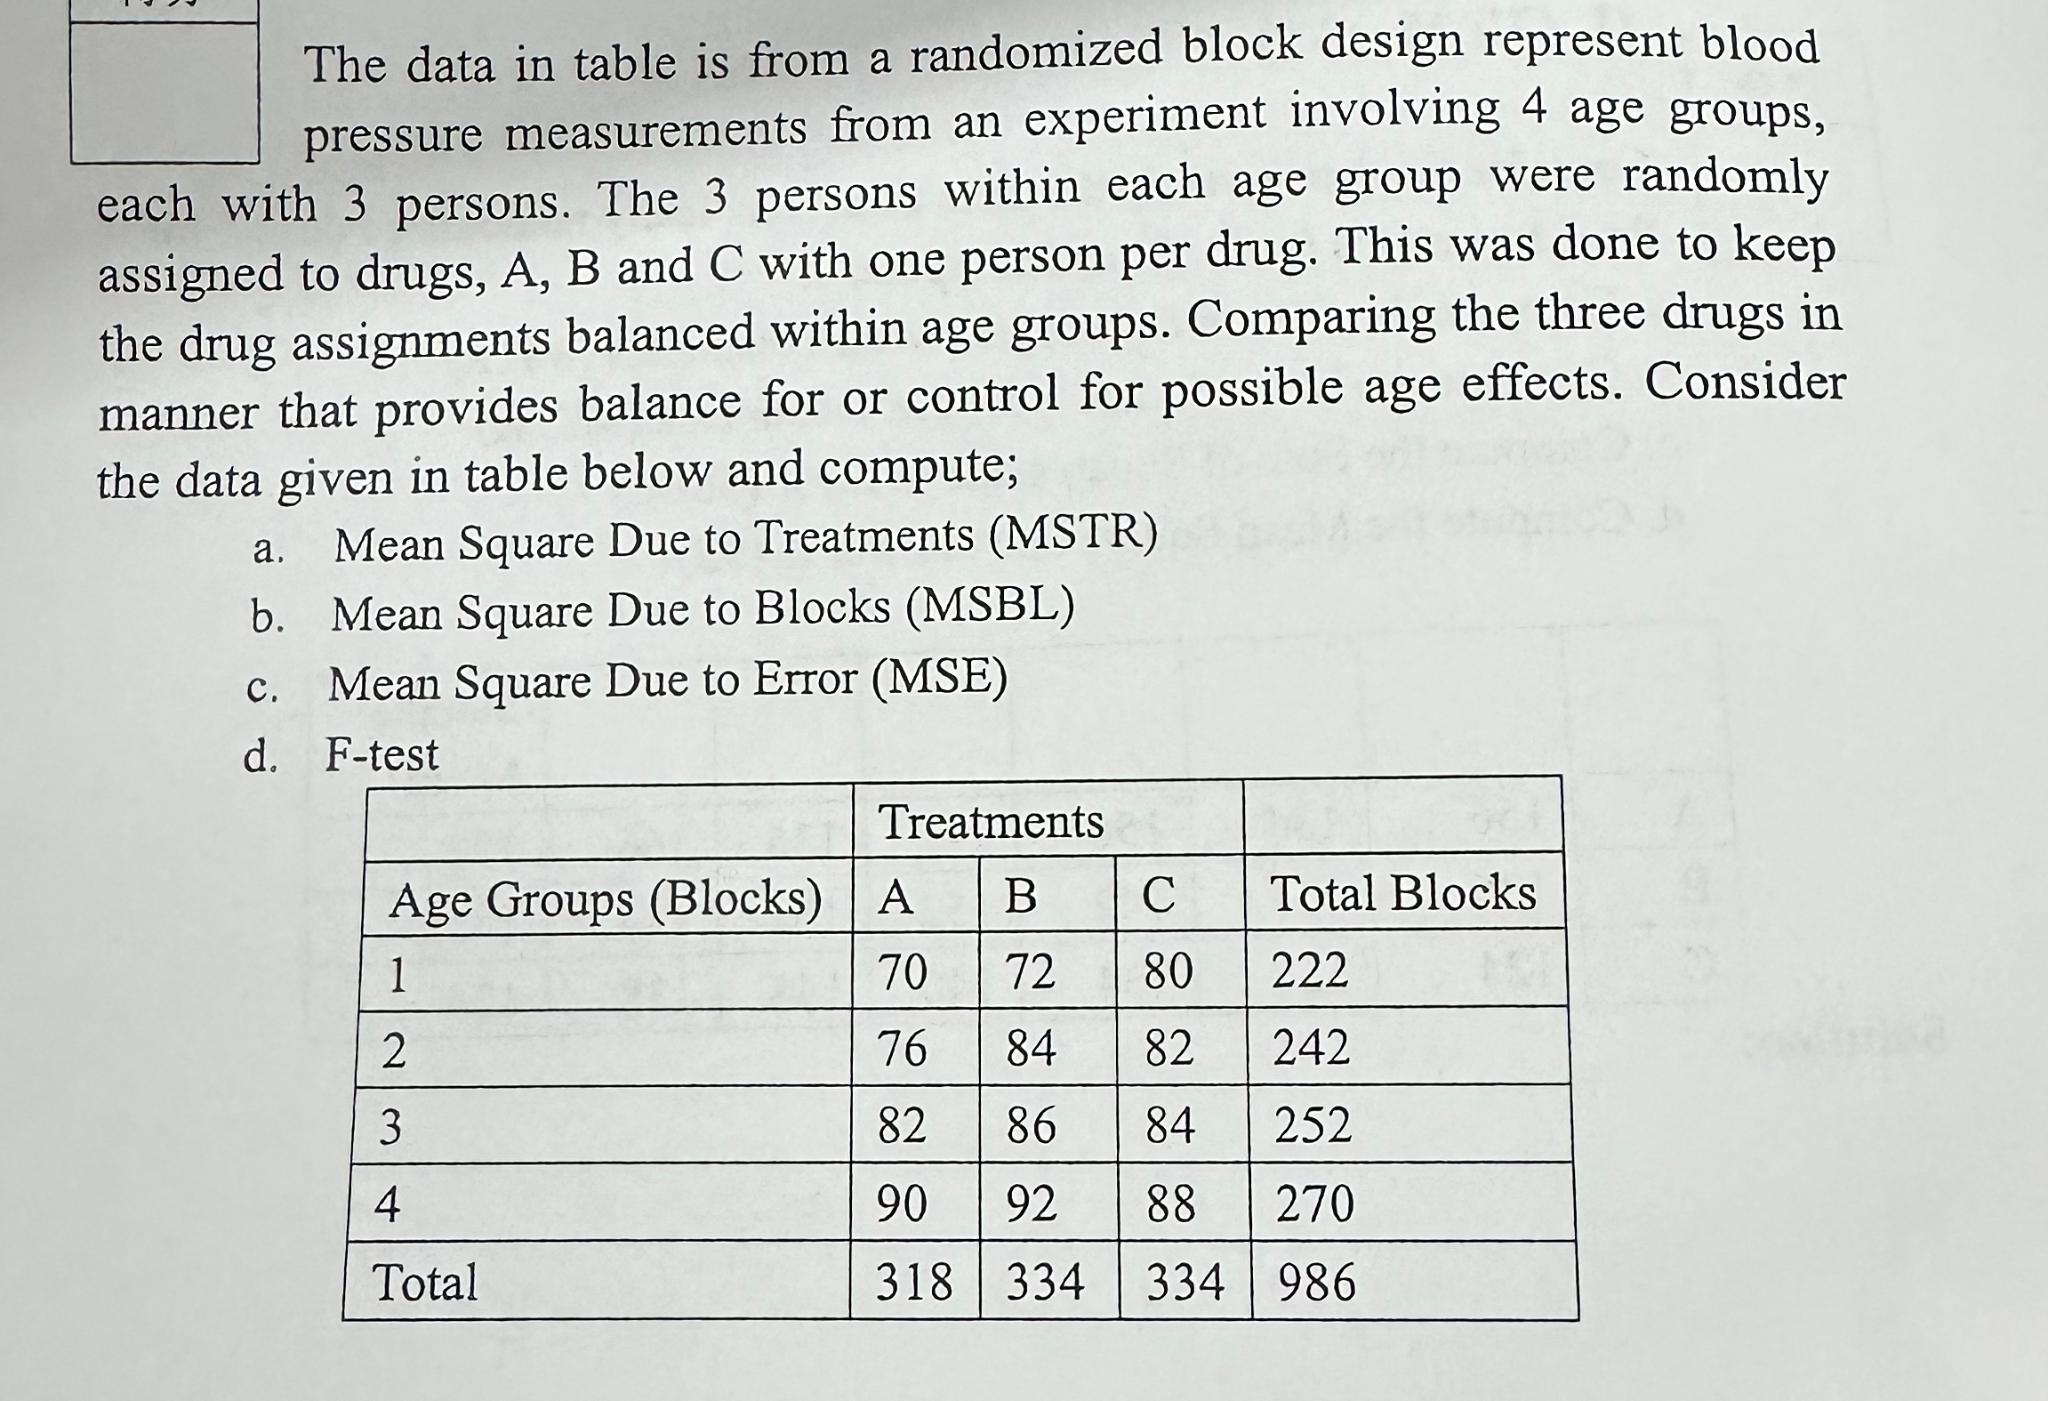
Question: The data in table is from a randomized block design represent blood pressure measurements from an experiment involving 4 age groups, each with 3 persons.
The data in table is from a randomized block design represent blood pressure measurements from an experiment involving age groups, each with persons. The persons within each age group were randomly assigned to drugs, A B and C with one person per drug. This was done to keep the drug assignments balanced within age groups. Comparing the three drugs in manner that provides balance for or control for possible age effects. Consider the data given in table below and compute;
a Mean Square Due to Treatments MSTR
b Mean Square Due to Blocks MSBL
c Mean Square Due to Error MSE
d Ftest
tableTreatments,Age Groups BlocksABCTotal BlocksTotal
Step by Step Solution
There are 3 Steps involved in it
1 Expert Approved Answer
Step: 1 Unlock

Question Has Been Solved by an Expert!
Get step-by-step solutions from verified subject matter experts
Step: 2 Unlock
Step: 3 Unlock