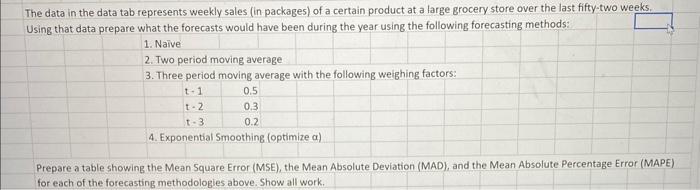
Question: The data in the data tab represents weekly sales (in packages) of a certain product at a large grocery store over the last fifty-two weeks.

The data in the data tab represents weekly sales
The data in the data tab represents weekly sales (in packages) of a certain product at a large grocery store over the last fifty-two weeks. Using that data prepare what the forecasts would have been during the year using the following forecasting methods: 1. Naive 2. Two period moving average 3. Three period moving average with the following weighing factors: 4. Exponential Smoothing (optimize a) Prepare a table showing the Mean Square Error (MSE), the Mean Absolute Deviation (MAD), and the Mean Absolute Percentage Error (MAPE) for each of the forecasting methodologies above. Show all work. The data in the data tab represents weekly sales (in packages) of a certain product at a large grocery store over the last fifty-two weeks. Using that data prepare what the forecasts would have been during the year using the following forecasting methods: 1. Naive 2. Two period moving average 3. Three period moving average with the following weighing factors: 4. Exponential Smoothing (optimize a) Prepare a table showing the Mean Square Error (MSE), the Mean Absolute Deviation (MAD), and the Mean Absolute Percentage Error (MAPE) for each of the forecasting methodologies above. Show all work

Step by Step Solution

There are 3 Steps involved in it

1 Expert Approved Answer
Step: 1 Unlock blur-text-image
Question Has Been Solved by an Expert!

Get step-by-step solutions from verified subject matter experts

Step: 2 Unlock
Step: 3 Unlock

Students Have Also Explored These Related General Management Questions!