

Question: The data in the table below represent the monthly cost of goods sold by a suburban Melbourne retail store for the past 24 months. fSUMMARY
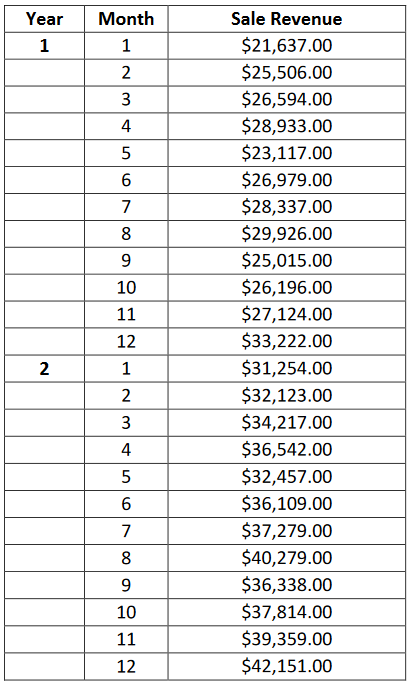
The data in the table below represent the monthly cost of goods sold by a suburban Melbourne retail store for the past 24 months.
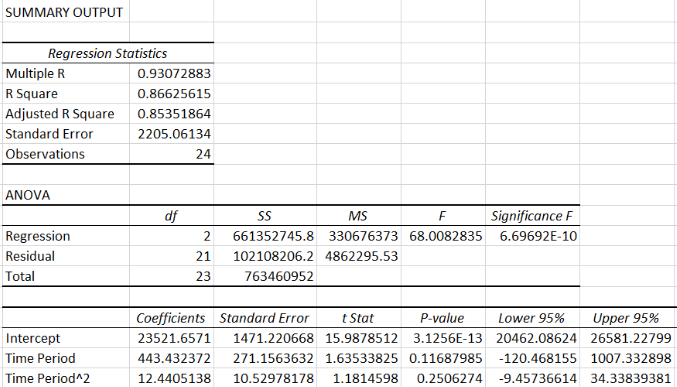
\fSUMMARY OUTPUT Regression Statistics Multiple R 0.93072883 R Square 0.86625615 Adjusted R Square 0.85351864 Standard Error 2205.06134 Observations 24 ANOVA df SS MS F Significance F Regression 2 661352745.8 330676373 68.0082835 6.69692E-10 Residual 21 102108206.2 4862295.53 Total 23 763460952 Coefficients Standard Error t Stat P-value Lower 95% Upper 95% Intercept 23521.6571 1471.220668 15.9878512 3.1256E-13 20462.08624 26581.22799 Time Period 443.432372 271.1563632 1.63533825 0.11687985 -120.468155 1007.332898 Time Period^2 12.4405138 10.52978178 1.1814598 0.2506274 -9.45736614 34.33839381
Step by Step Solution
There are 3 Steps involved in it

Get step-by-step solutions from verified subject matter experts