

Question: The data in the table below represent the monthly power bills for a California homeowner. Enter the data in a graphing utility and use the
The data in the table below represent the monthly power bills for a California homeowner. Enter the data in a graphing utility and use the sinusoidal regression tool to find a model of the formA(t)=asin(bt+c)+d whereA(t) represents the amount of the bill for montht, wheret=1 represents January.
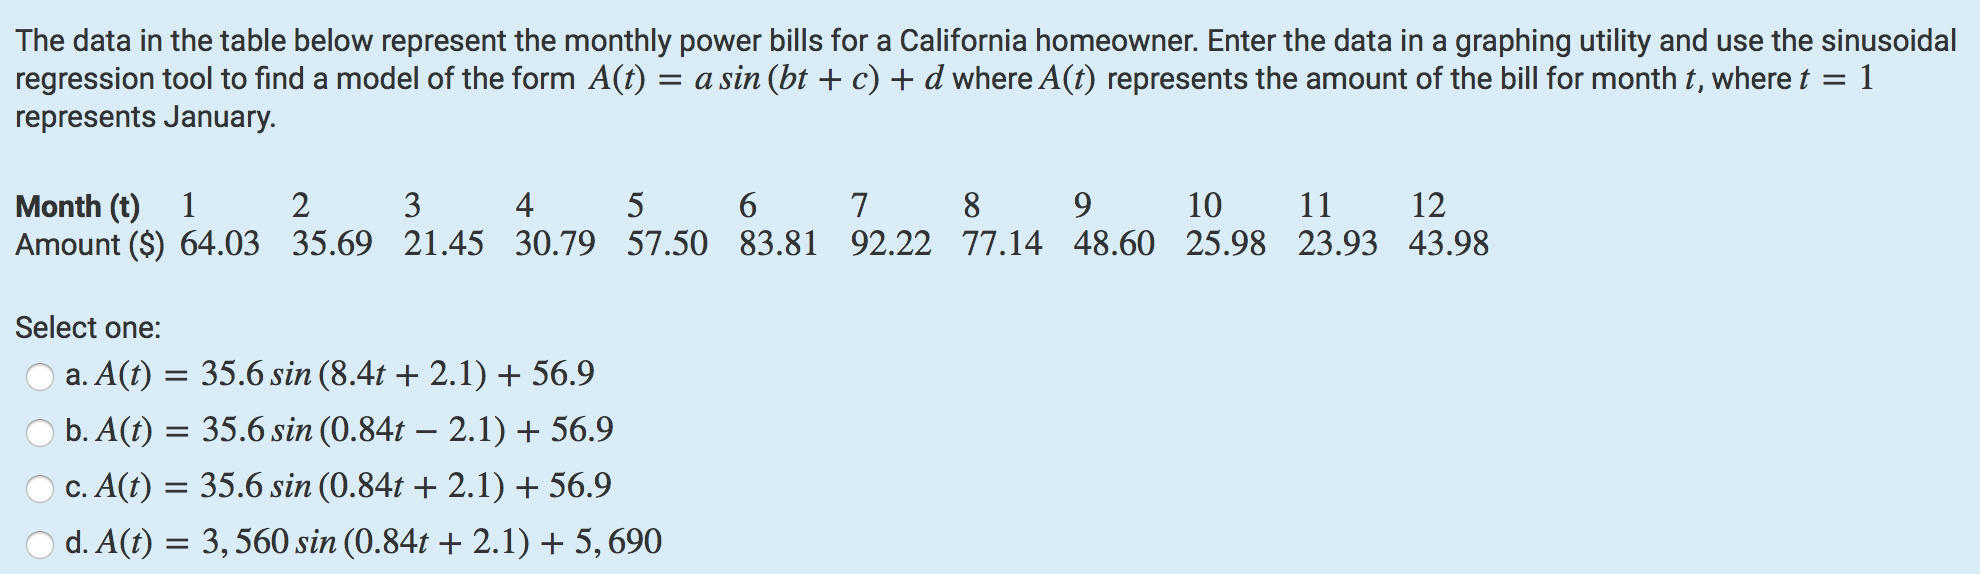
The data in the table below represent the monthly power bills for a California homeowner. Enter the data in a graphing utility and use the sinusoidal regression tool to find a model of the form A(t) = a sin (bt + c) + d where A(t) represents the amount of the bill for month t, where t = 1 represents January. Month (t) 1 2 3 4 5 6 7 8 9 10 11 12 Amount ($) 64.03 35.69 21.45 30.79 57.50 83.81 92.22 77.14 48.60 25.98 23.93 43.98 Select one: O a. A(t) = 35.6 sin (8.4t + 2.1) + 56.9 O b. A(t) = 35.6 sin (0.84t - 2.1) + 56.9 O c. A(t) = 35.6 sin (0.84t + 2.1) + 56.9 O d. A(t) = 3, 560 sin (0.84t + 2.1) + 5, 690
Step by Step Solution
There are 3 Steps involved in it

Get step-by-step solutions from verified subject matter experts