

Question: The data in the table below represents the annual tonnage (in 100000 ) of coal mined in the certain province for 8 consecutive years. (a)
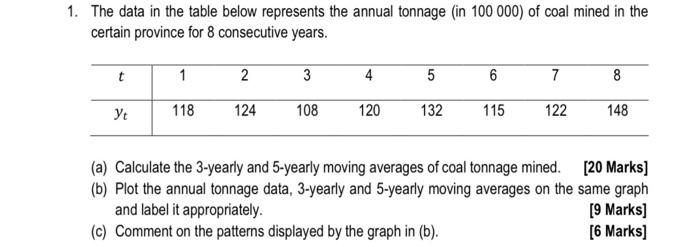
The data in the table below represents the annual tonnage (in 100000 ) of coal mined in the certain province for 8 consecutive years. (a) Calculate the 3-yearly and 5-yearly moving averages of coal tonnage mined. [20 Marks] (b) Plot the annual tonnage data, 3-yearly and 5-yearly moving averages on the same graph and label it appropriately. [9 Marks] (c) Comment on the patterns displayed by the graph in (b). [6 Marks]
Step by Step Solution
There are 3 Steps involved in it
1 Expert Approved Answer
Step: 1 Unlock

Question Has Been Solved by an Expert!
Get step-by-step solutions from verified subject matter experts
Step: 2 Unlock
Step: 3 Unlock