

Question: The data in the table below were obtained through a survey individuals in Ontario Speeding Tickets Received Within the Last Year? Yes No Male 28
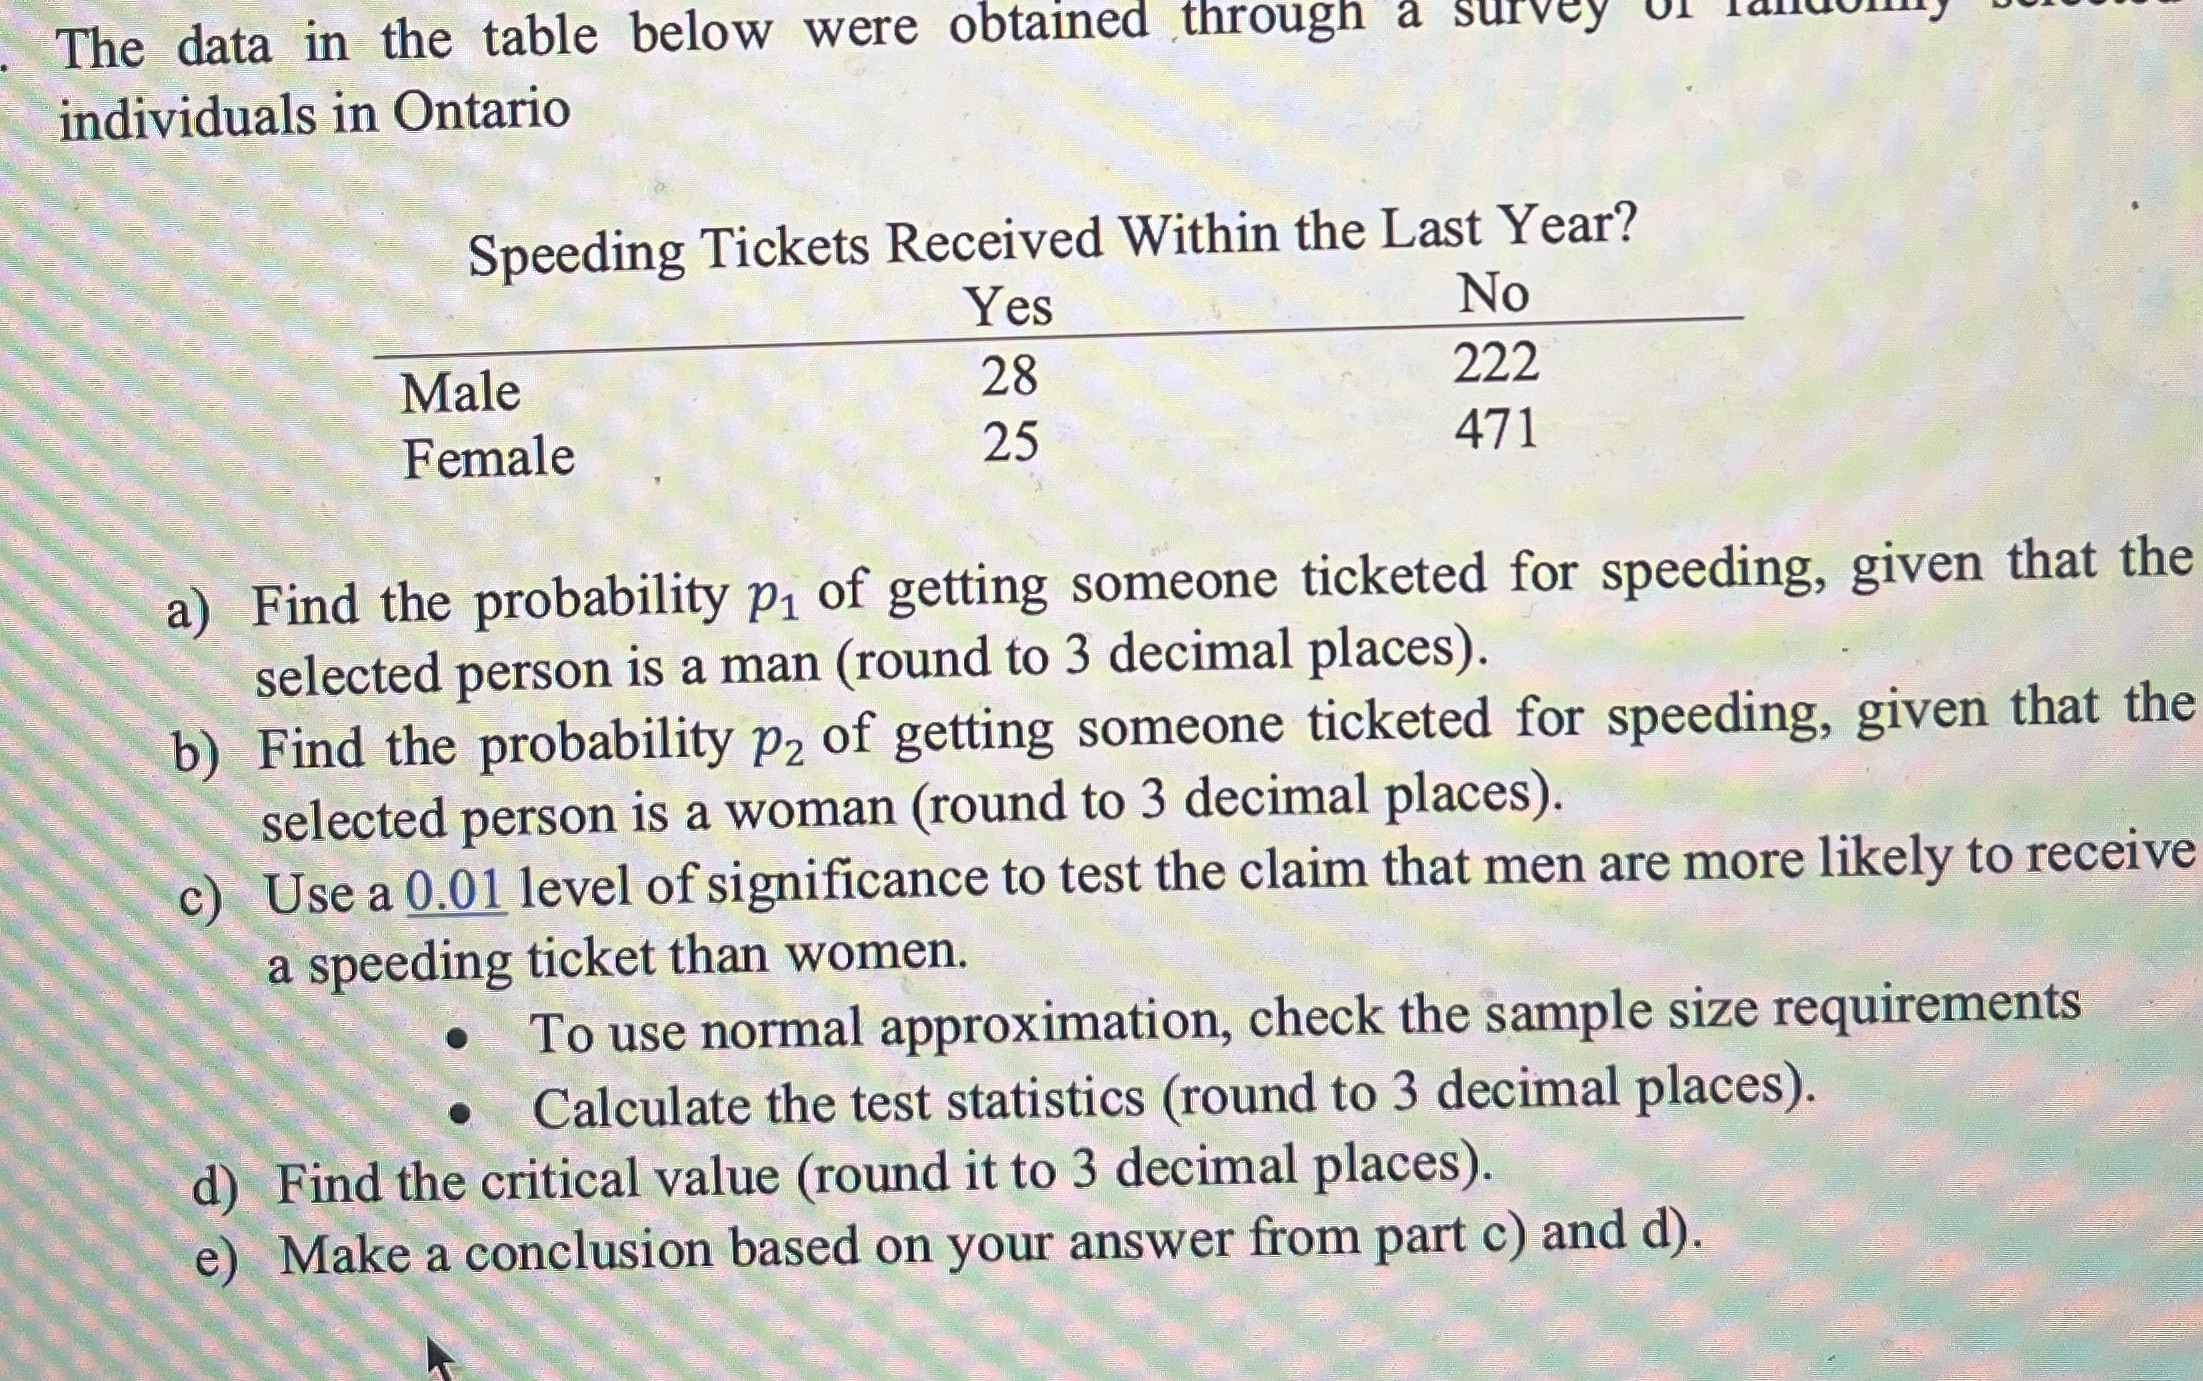
The data in the table below were obtained through a survey individuals in Ontario Speeding Tickets Received Within the Last Year? Yes No Male 28 222 Female 25 471 a) Find the probability p1 of getting someone ticketed for speeding, given that the selected person is a man (round to 3 decimal places). b) Find the probability p2 of getting someone ticketed for speeding, given that the selected person is a woman (round to 3 decimal places). c) Use a 0.01 level of significance to test the claim that men are more likely to receive a speeding ticket than women. To use normal approximation, check the sample size requirements Calculate the test statistics (round to 3 decimal places). d) Find the critical value (round it to 3 decimal places). e) Make a conclusion based on your answer from part c) and d)
Step by Step Solution
There are 3 Steps involved in it

Get step-by-step solutions from verified subject matter experts