

Question: The data in the tables below are independent random samples from Normal populations with unknown means. Sample A 16.9 19.0 16.7 14.7 2243 16.5 18.1
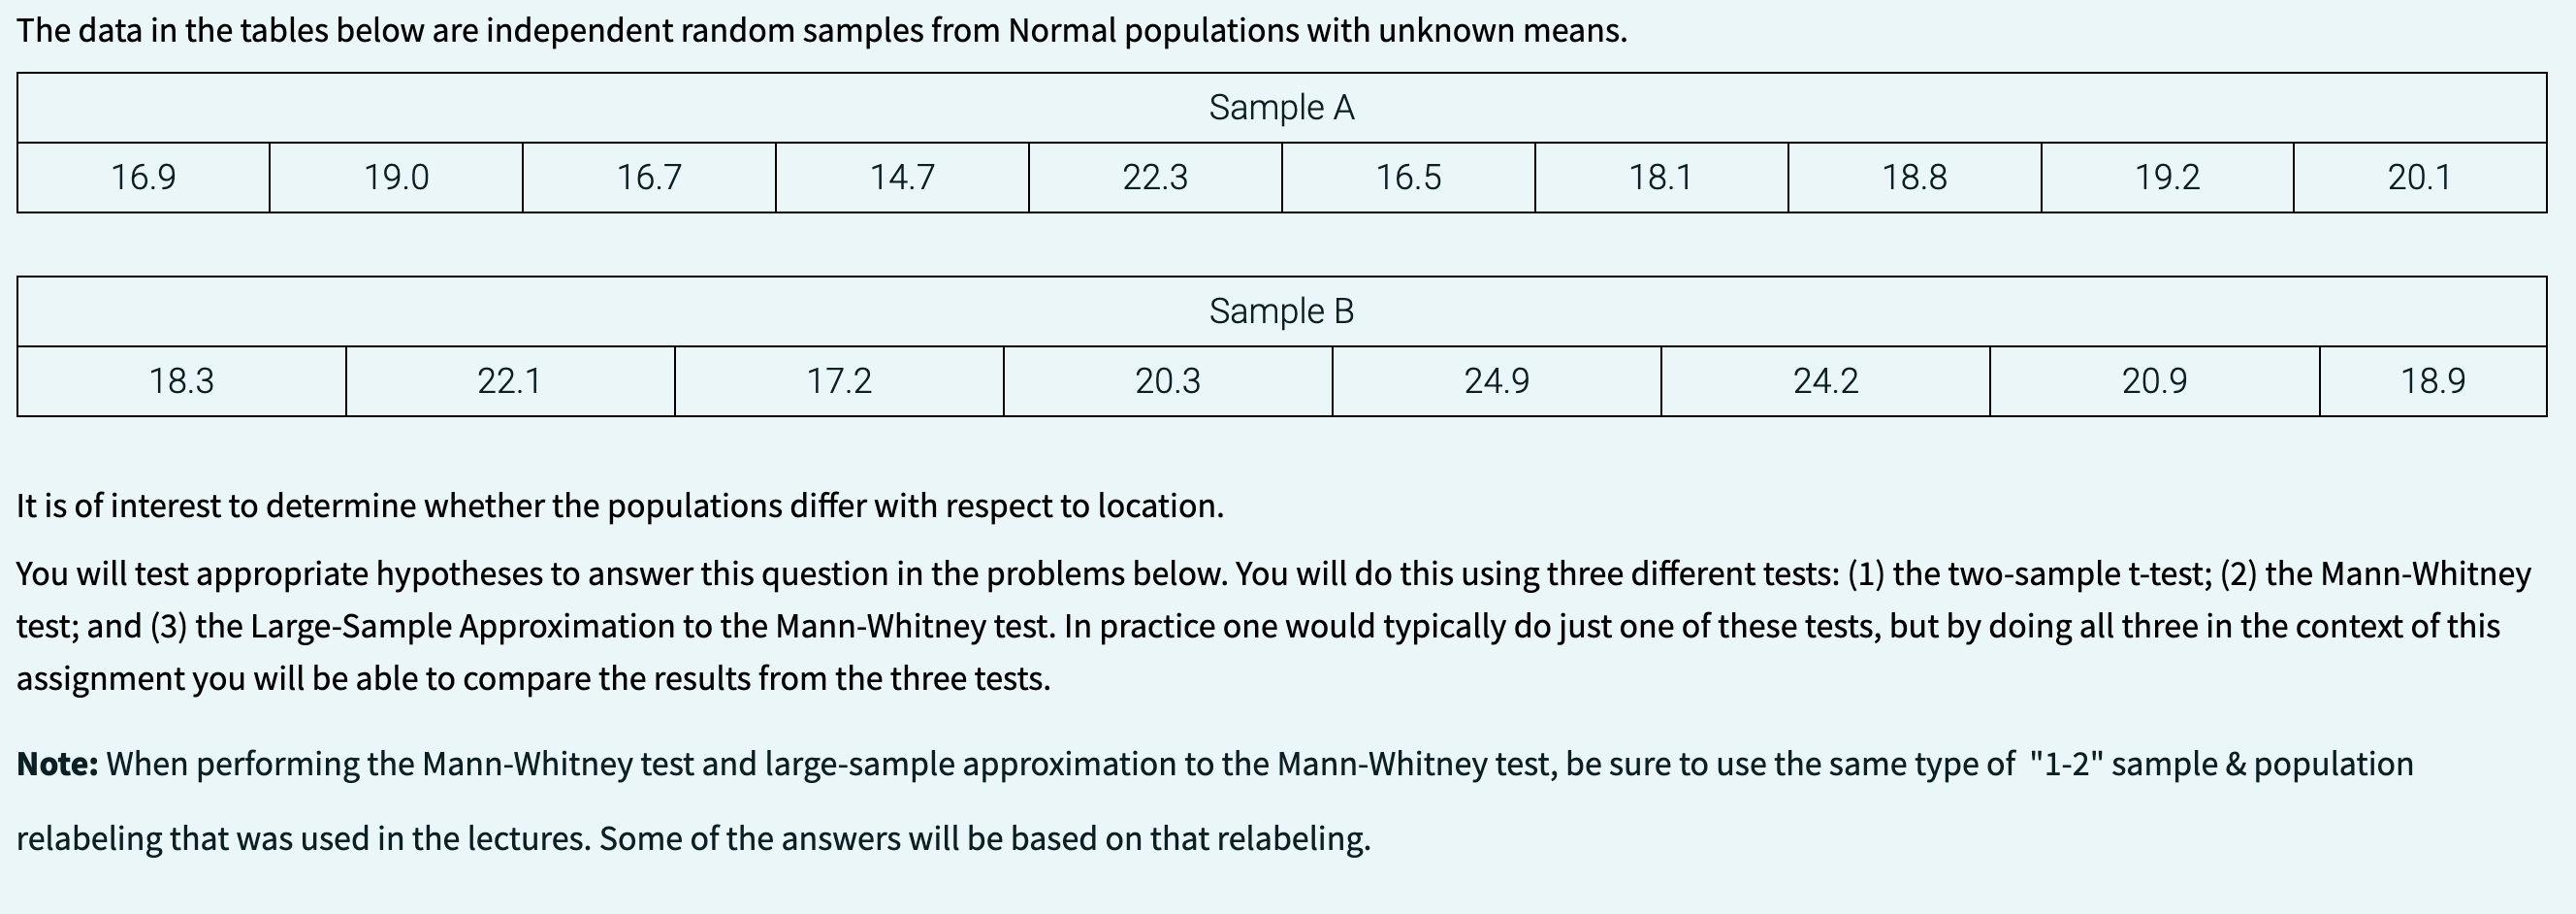
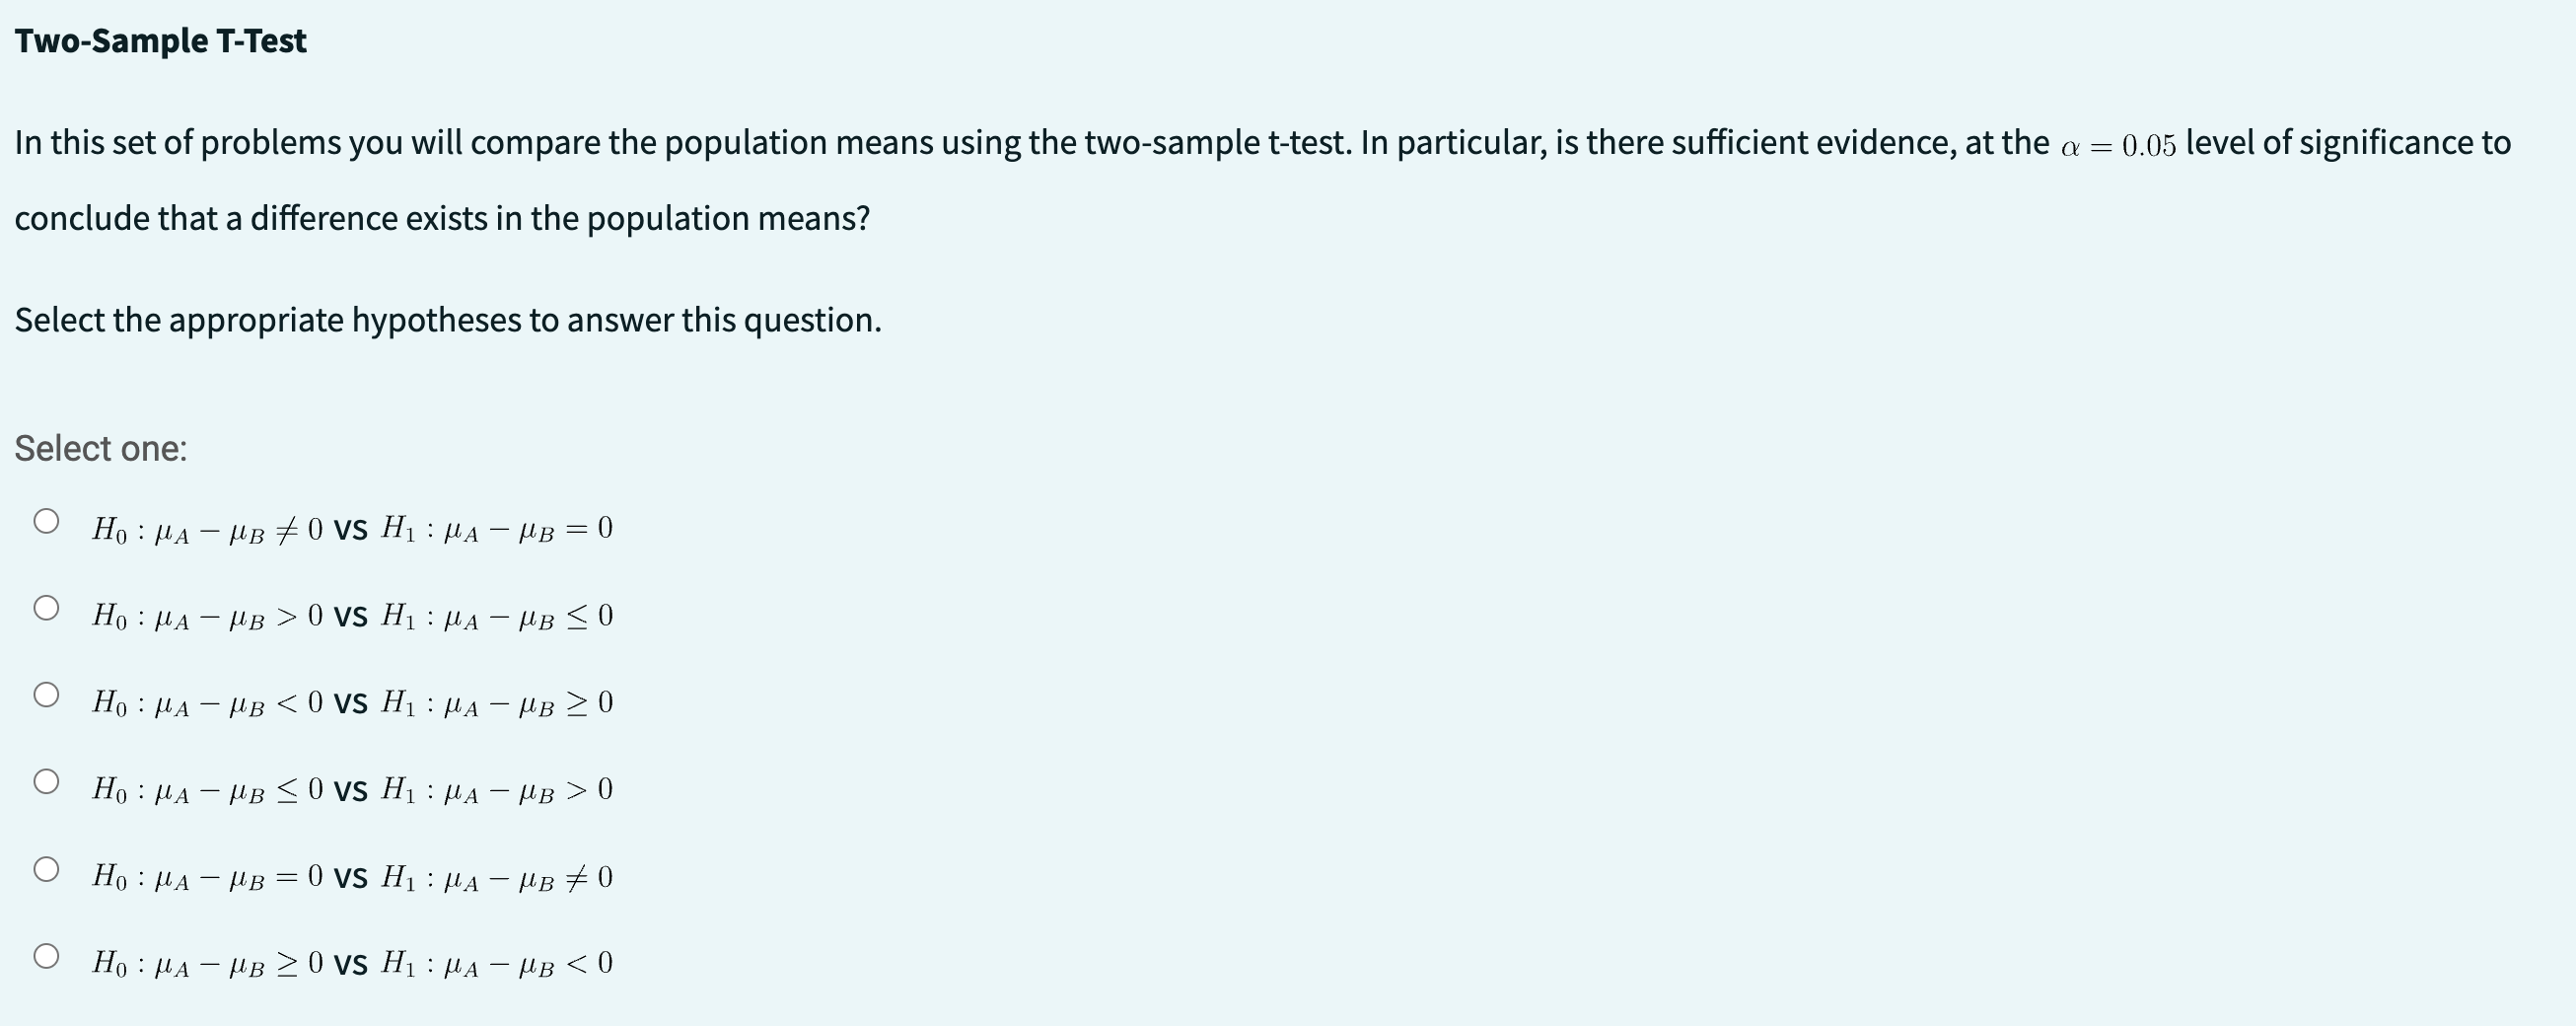
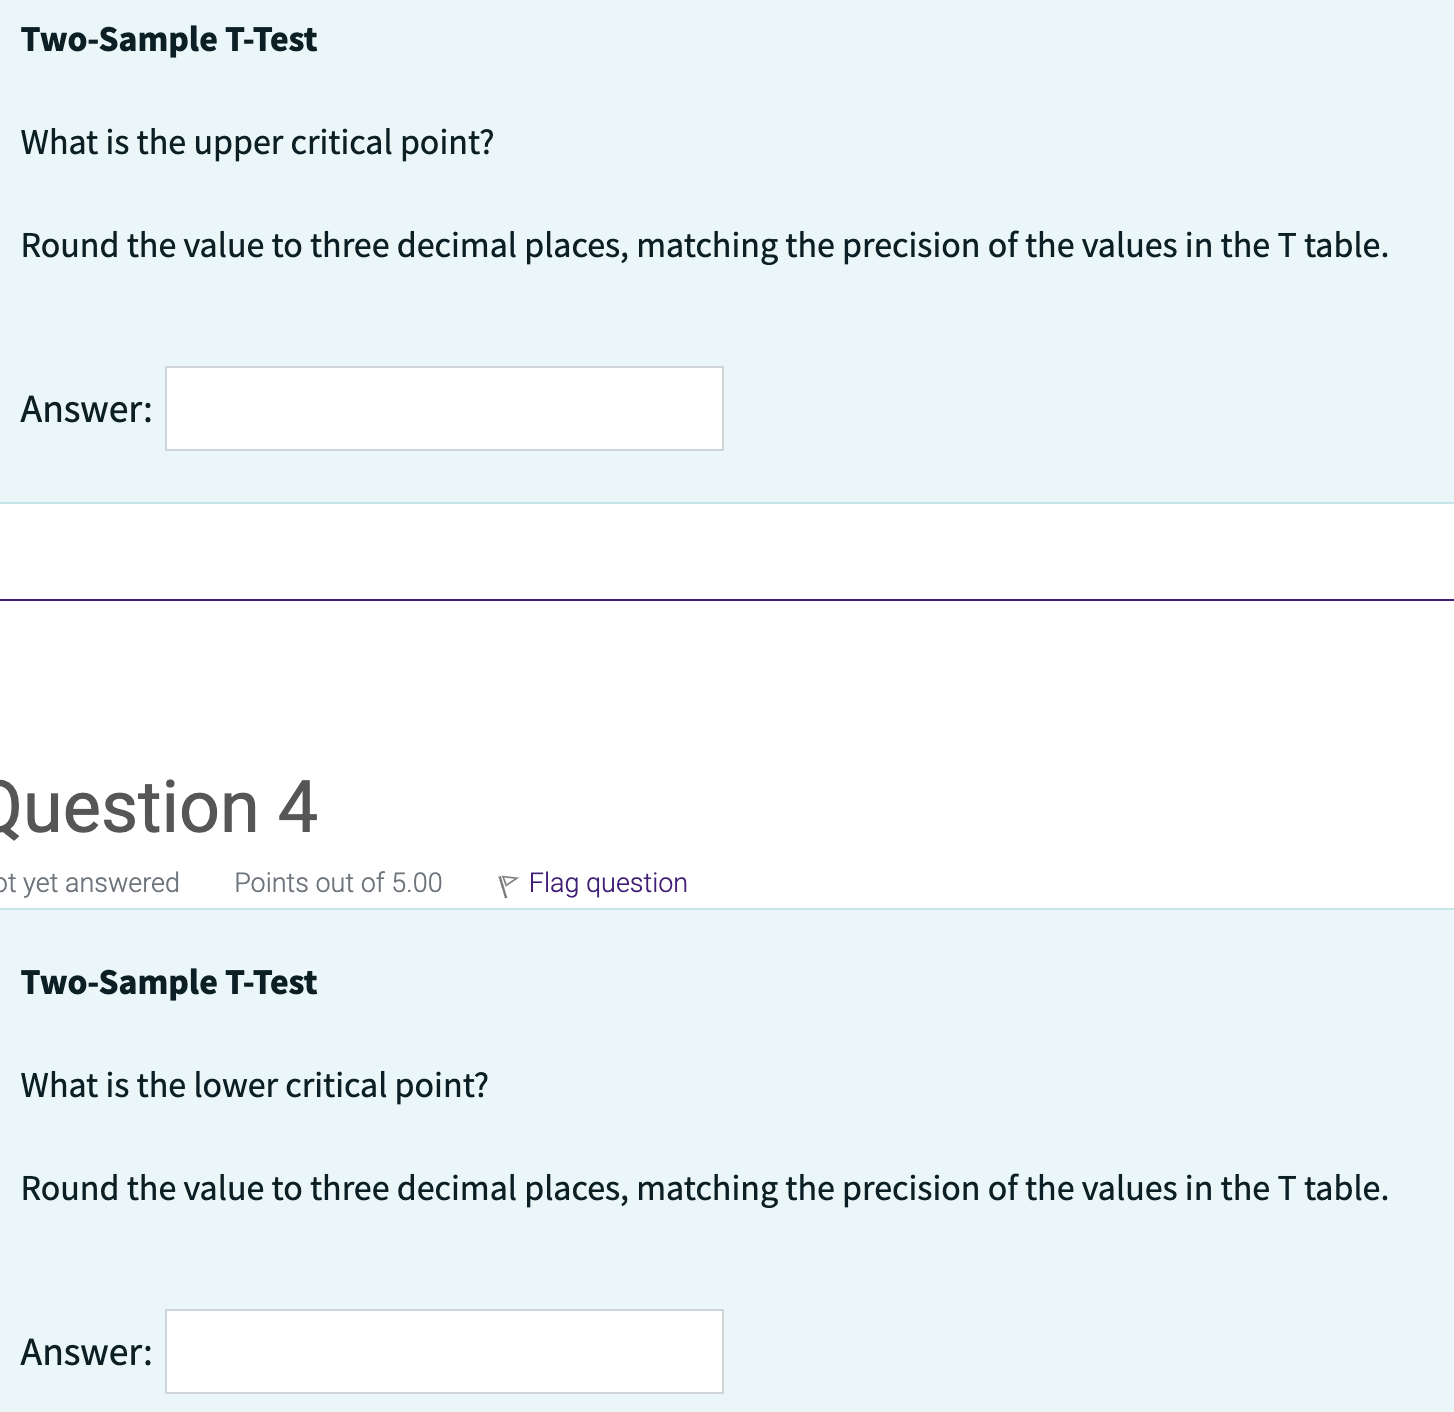
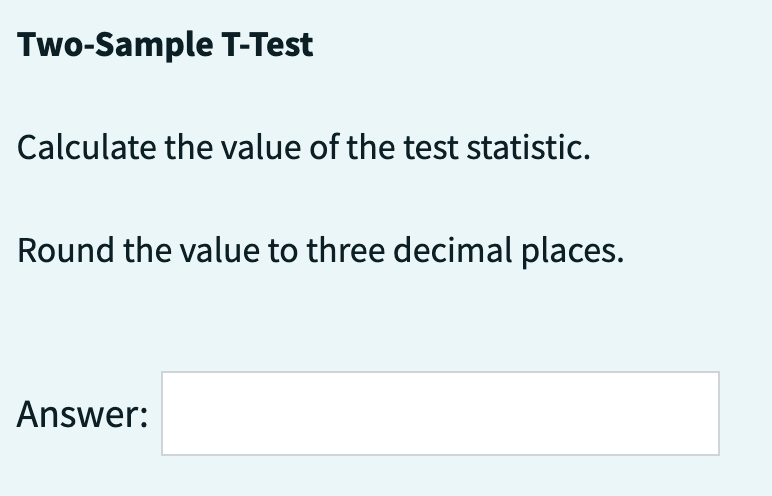
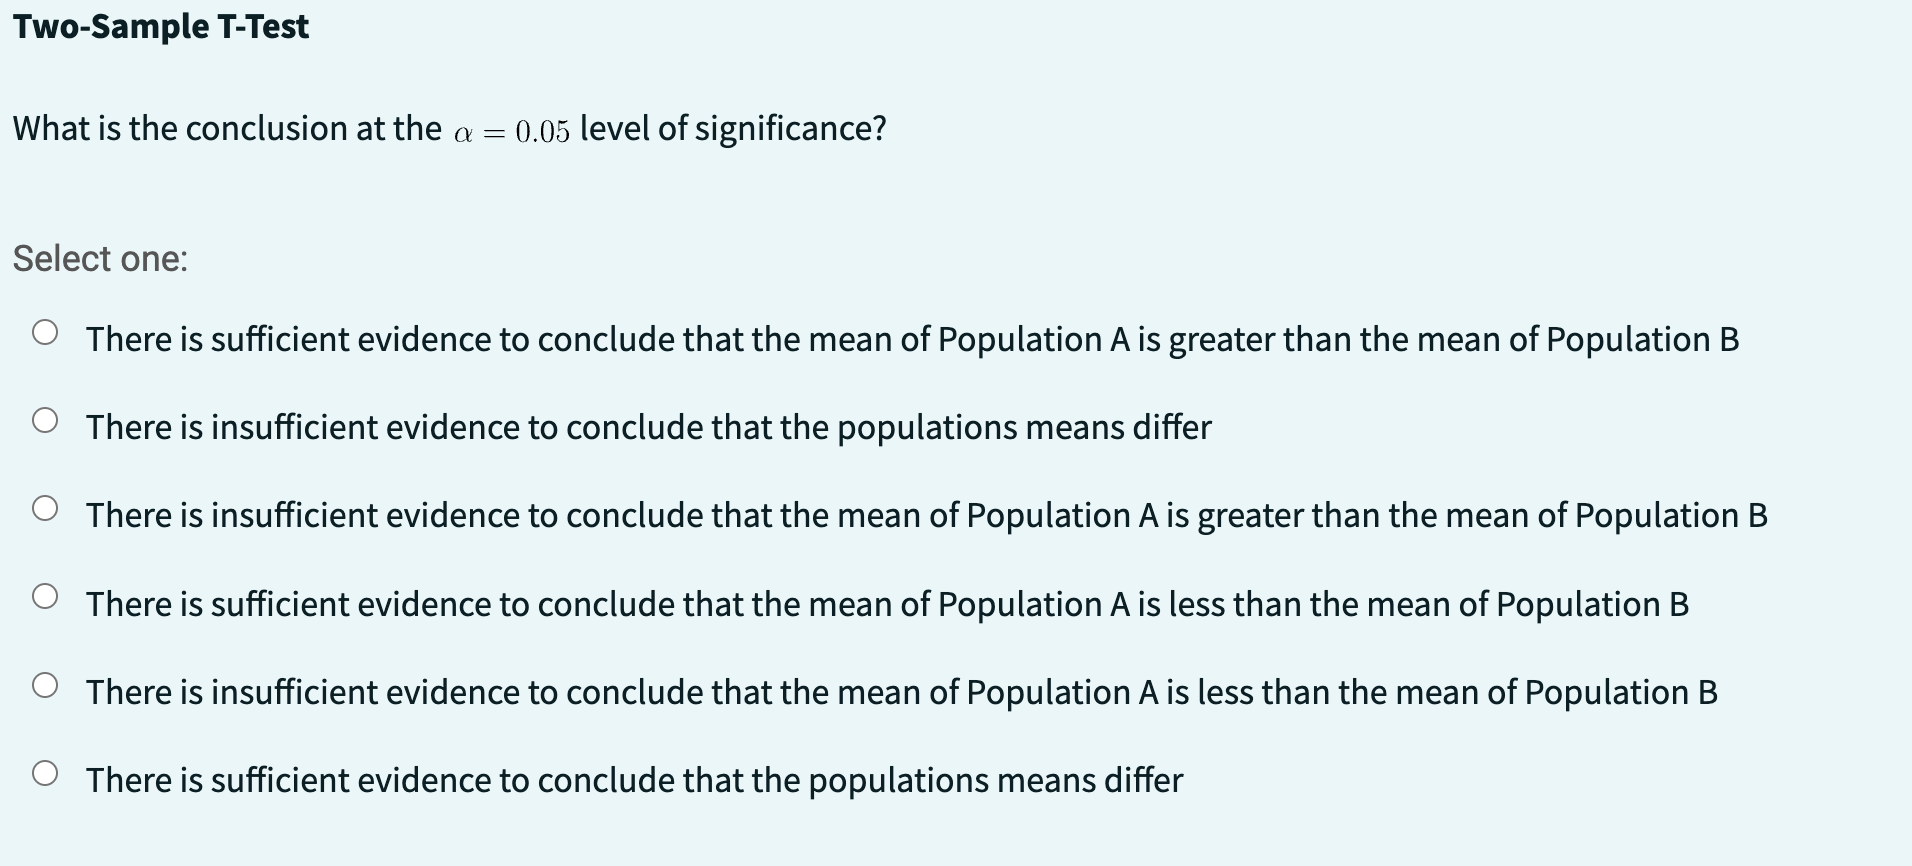
The data in the tables below are independent random samples from Normal populations with unknown means. Sample A 16.9 19.0 16.7 14.7 2243 16.5 18.1 18.8 19.2 20.1 Sample B 18.3 228 172 20.3 249 24.2 209 18.9 It is of interest to determine whether the populations differ with respect to location. You will test appropriate hypotheses to answer this question in the problems below. You will do this using three different tests: (1) the two-sample t-test; (2) the Mann-Whitney test; and (3) the Large-Sample Approximation to the Mann-Whitney test. In practice one would typically do just one of these tests, but by doing all three in the context of this assignment you will be able to compare the results from the three tests. Note: When performing the Mann-Whitney test and large-sample approximation to the Mann-Whitney test, be sure to use the same type of "1-2" sample & population relabeling that was used in the lectures. Some of the answers will be based on that relabeling. Two-Sample T-Test In this set of problems you will compare the population means using the two-sample t-test. In particular, is there sufficient evidence, at the a = 0.05 level of significance to conclude that a difference exists in the population means? Select the appropriate hypotheses to answer this question. Select one: O Ho : HA - MB # O VS H1 : MA - MB = 0 O Ho : MA - MB > O VS H1 : MA - MB ZO O Ho : HA - HB 0 O Ho : MA - MB = 0 VS H1 : MA - MB # 0 O Ho : MA - MB 2 0 VS H1 : MA - MB t yet answered Paints out of 5.00 v Flag question Two-Sample T-Test What is the lower critical point? Round the value to three decimal places, matching the precision of the values in the T table. Answer: Two-Sample T-Test Calculate the value of the test statistic. Round the value to three decimal places. Answer: Two-Sample T-Test What is the conclusion at the o = (.05 level of significance? Select one: O O o O O O There is sufficient evidence to conclude that the mean of Population A is greater than the mean of Population B There is insufficient evidence to conclude that the populations means differ There is insufficient evidence to conclude that the mean of Population A is greater than the mean of Population B There is sufficient evidence to conclude that the mean of Population A is less than the mean of Population B There is insufficient evidence to conclude that the mean of Population A is less than the mean of Population B There is sufficient evidence to conclude that the populations means differ
Step by Step Solution
There are 3 Steps involved in it

Get step-by-step solutions from verified subject matter experts