

Question: The data is taken from https://www.abs.gov.au/ Data covering the period January 2011 - present (i) nominal GDP [referred to as 'GDP at current prices'](quarterly) (ii)
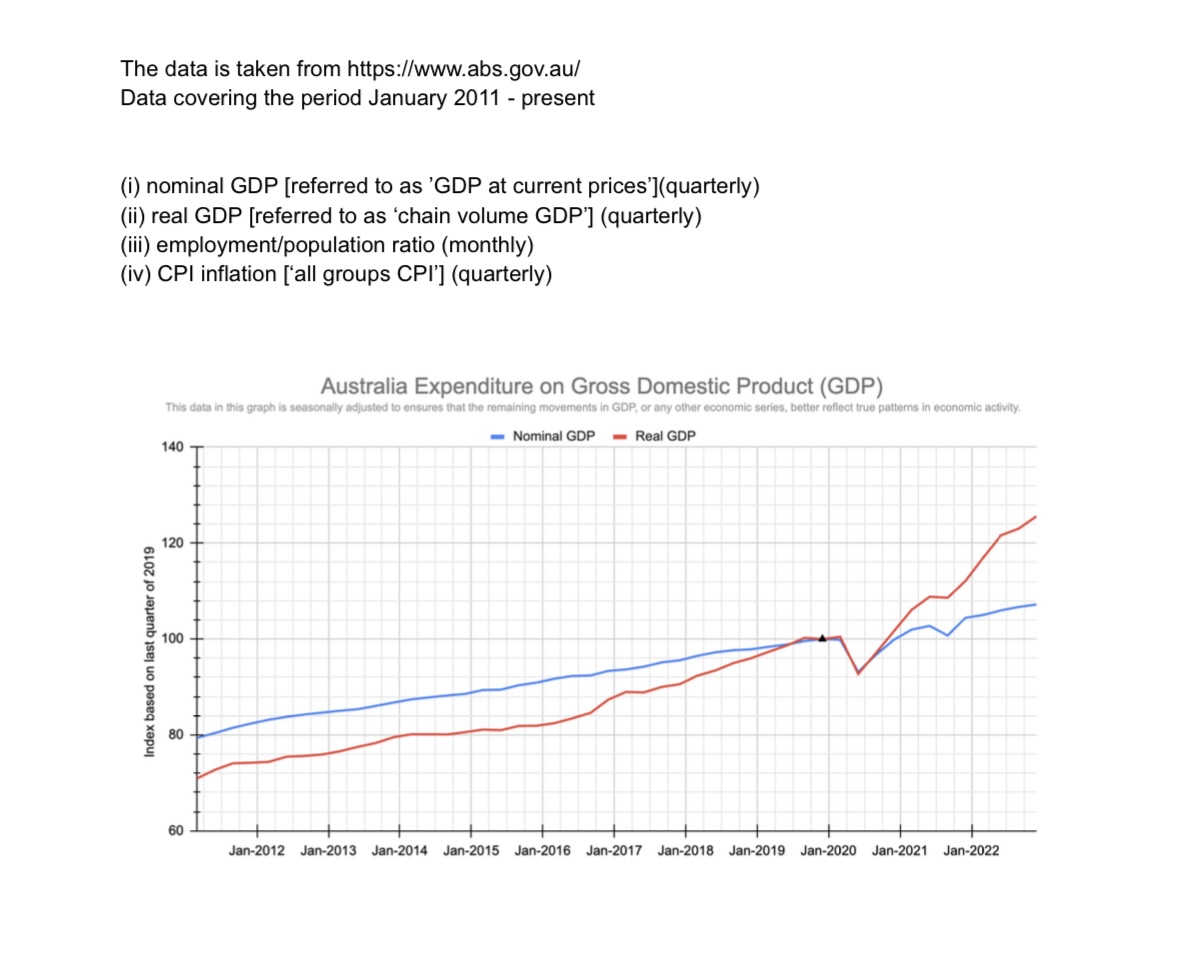
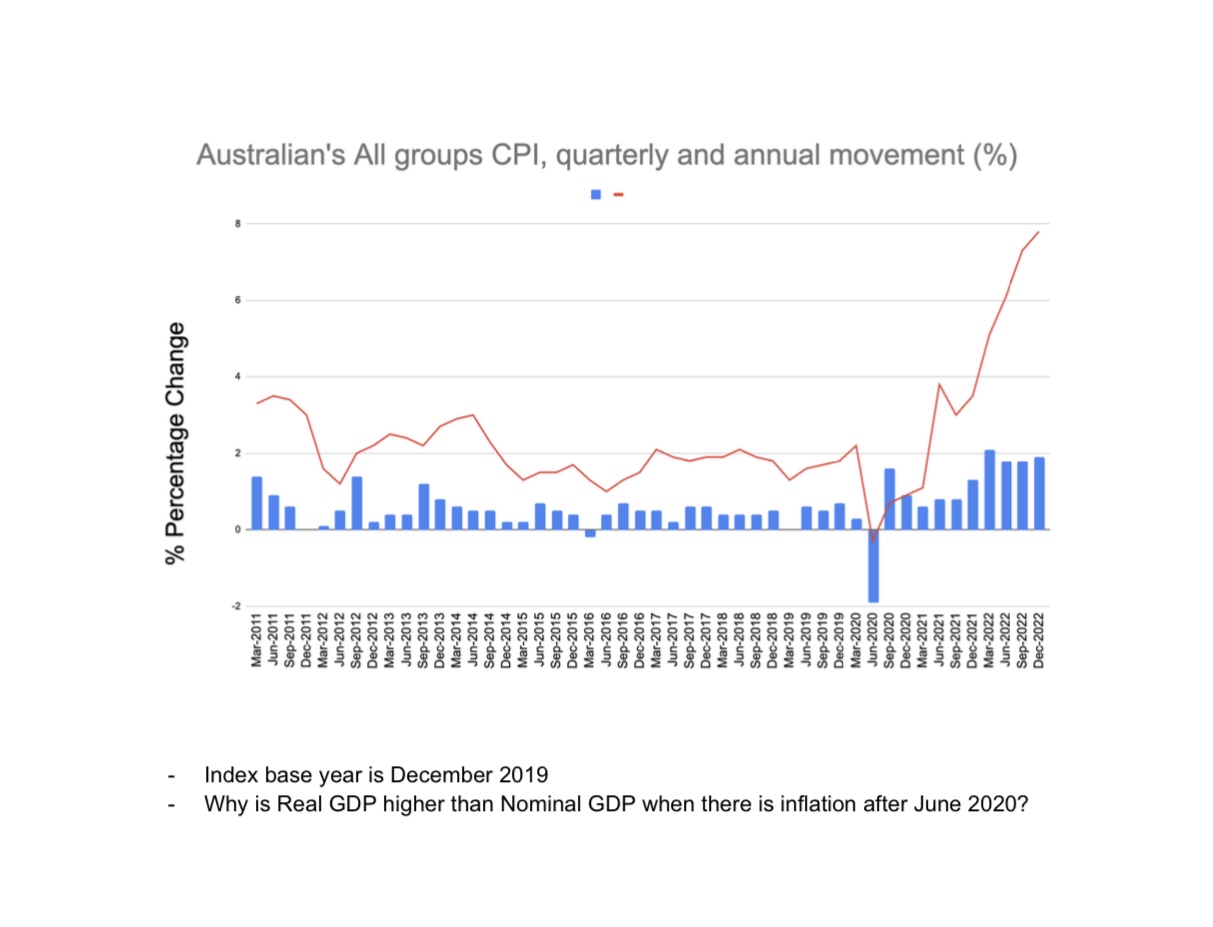
The data is taken from https://www.abs.gov.au/ Data covering the period January 2011 - present (i) nominal GDP [referred to as 'GDP at current prices'](quarterly) (ii) real GDP [referred to as 'chain volume GDP'] (quarterly) (iii) employment/population ratio (monthly) (iv) CPI inflation ['all groups CPI'] (quarterly) Australia Expenditure on Gross Domestic Product (GDP) This data in this graph is seasonally adjusted to ensures that the remaining movements in GDP, or any other economic series, better reflect true patterns in economic activity. - Nominal GDP - Real GDP 140 T 120 100 Index based on last quarter of 2019 80 60 Jan-2012 Jan-2013 Jan-2014 Jan-2015 Jan-2016 Jan-2017 Jan-2018 Jan-2019 Jan-2020 Jan-2021 Jan-2022Australian's All groups CPI, quarterly and annual movement (%) % Percentage Change 2 Index base year is December 2019 - Why is Real GDP higher than Nominal GDP when there is inflation after June 2020
Step by Step Solution
There are 3 Steps involved in it

Get step-by-step solutions from verified subject matter experts