

Question: The data listed below is recorded during a tensile test. The maximum load occurred at 28,960 N. The gauge length is 100 mm and
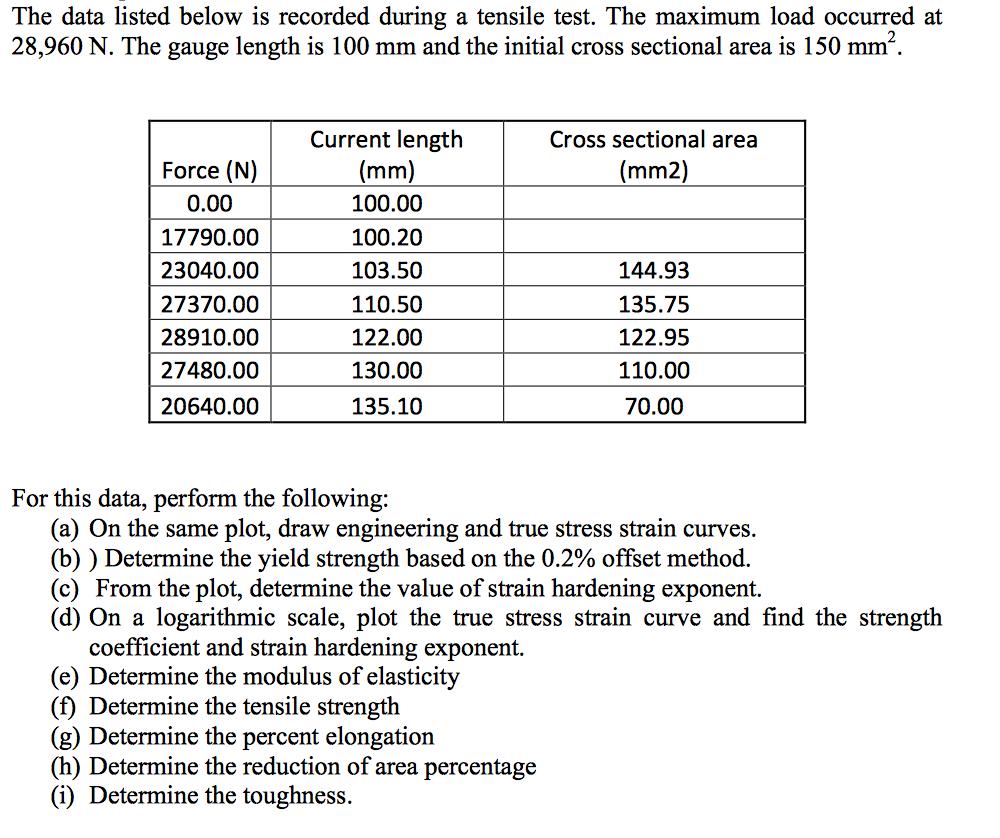
The data listed below is recorded during a tensile test. The maximum load occurred at 28,960 N. The gauge length is 100 mm and the initial cross sectional area is 150 mm. Force (N) 0.00 17790.00 23040.00 27370.00 28910.00 27480.00 20640.00 Current length (mm) 100.00 100.20 103.50 110.50 122.00 130.00 135.10 Cross sectional area (mm2) 144.93 135.75 122.95 110.00 70.00 For this data, perform the following: (a) On the same plot, draw engineering and true stress strain curves. (b)) Determine the yield strength based on the 0.2% offset method. (c) From the plot, determine the value of strain hardening exponent. (d) On a logarithmic scale, plot the true stress strain curve and find the strength coefficient and strain hardening exponent. (e) Determine the modulus of elasticity (f) Determine the tensile strength (g) Determine the percent elongation (h) Determine the reduction of area percentage (i) Determine the toughness.
Step by Step Solution
3.48 Rating (164 Votes )
There are 3 Steps involved in it
ANSWER Tabulate the values a Plot the load displacement diagram b 35000 30000 25000 20000 15000 ... View full answer

Get step-by-step solutions from verified subject matter experts