

Question: The data needed is provided in the chart , Excel Online Structured Activity: Characteristic Line and Security Market Line You are given the following set
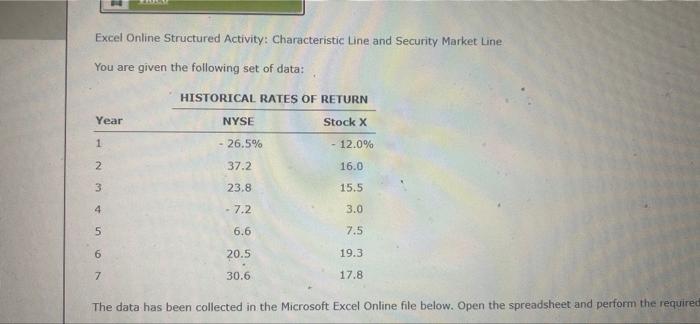
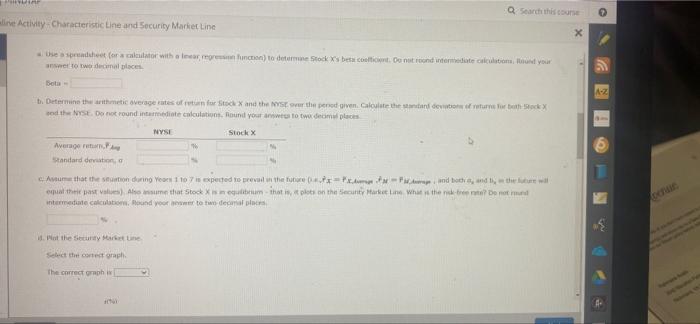
Excel Online Structured Activity: Characteristic Line and Security Market Line You are given the following set of data: HISTORICAL RATES OF RETURN Year NYSE Stock X 1 - 26.5% 12.0% 37.2 16.0 23.8 15.5 - 7.2 3.0 6.6 7.5 20.5 19.3 7 30.6 17.8 The data has been collected in the Microsoft Excel Online file below. Open the spreadsheet and perform the required 2 3456 PRIME Q Search this course live Activity-Characteristic Line and Security Market Line X Use a spreadsheet (or a calculator with a leear, regression function) to determine Stock X's beta coefficient. Do not roond intermediate calculations, Round your answer to two decimal places. Beta- b. Determine the arithmetic overage rates of return for Stock X and the NYSE over the period given. Calculate the standard deviations of returns for both Stock X and the NYSE. Do not round intermediate calculations. Round your answers to two decimal places NYSE Stock X Average retum, Standard deviation, o Assume that the situation during Years 1 to 7 is expected to prevail in the future (PPp, and both, and the future will equal their past values). Also assume that Stock X is in equilibrium-that is, it plots on the Security Market Line What is the risk-free rate? Do not und intermediate calculations. Round your answer to two decamal places 4. Plot the Security Market Line Select the correct graph. The correct graph is C A-Z 40 F G perair Excel Online Structured Activity: Characteristic Line and Security Market Line You are given the following set of data: HISTORICAL RATES OF RETURN Year NYSE Stock X 1 - 26.5% 12.0% 37.2 16.0 23.8 15.5 - 7.2 3.0 6.6 7.5 20.5 19.3 7 30.6 17.8 The data has been collected in the Microsoft Excel Online file below. Open the spreadsheet and perform the required 2 3456 PRIME Q Search this course live Activity-Characteristic Line and Security Market Line X Use a spreadsheet (or a calculator with a leear, regression function) to determine Stock X's beta coefficient. Do not roond intermediate calculations, Round your answer to two decimal places. Beta- b. Determine the arithmetic overage rates of return for Stock X and the NYSE over the period given. Calculate the standard deviations of returns for both Stock X and the NYSE. Do not round intermediate calculations. Round your answers to two decimal places NYSE Stock X Average retum, Standard deviation, o Assume that the situation during Years 1 to 7 is expected to prevail in the future (PPp, and both, and the future will equal their past values). Also assume that Stock X is in equilibrium-that is, it plots on the Security Market Line What is the risk-free rate? Do not und intermediate calculations. Round your answer to two decamal places 4. Plot the Security Market Line Select the correct graph. The correct graph is C A-Z 40 F G perair
Step by Step Solution
There are 3 Steps involved in it

Get step-by-step solutions from verified subject matter experts