

Question: The data presented in the table below resulted from an experiment in which seeds of 4 different types were planted and the number of seeds

The data presented in the table below resulted from an experiment in which seeds of 4 different types were planted and the number of seeds that germinated within 4 weeks after planting was recorded for each seed type.At the .05 level of significance, is the proportion of seeds that germinate dependent on the seed type?Seed TypeObserved FrequenciesGerminatedFailed to Germinate1399254343886345742What is the Expected Count for Seed Type = 1 and a Failed to Germinated Seed?Question 9 options:18.40433.74157.89637.959
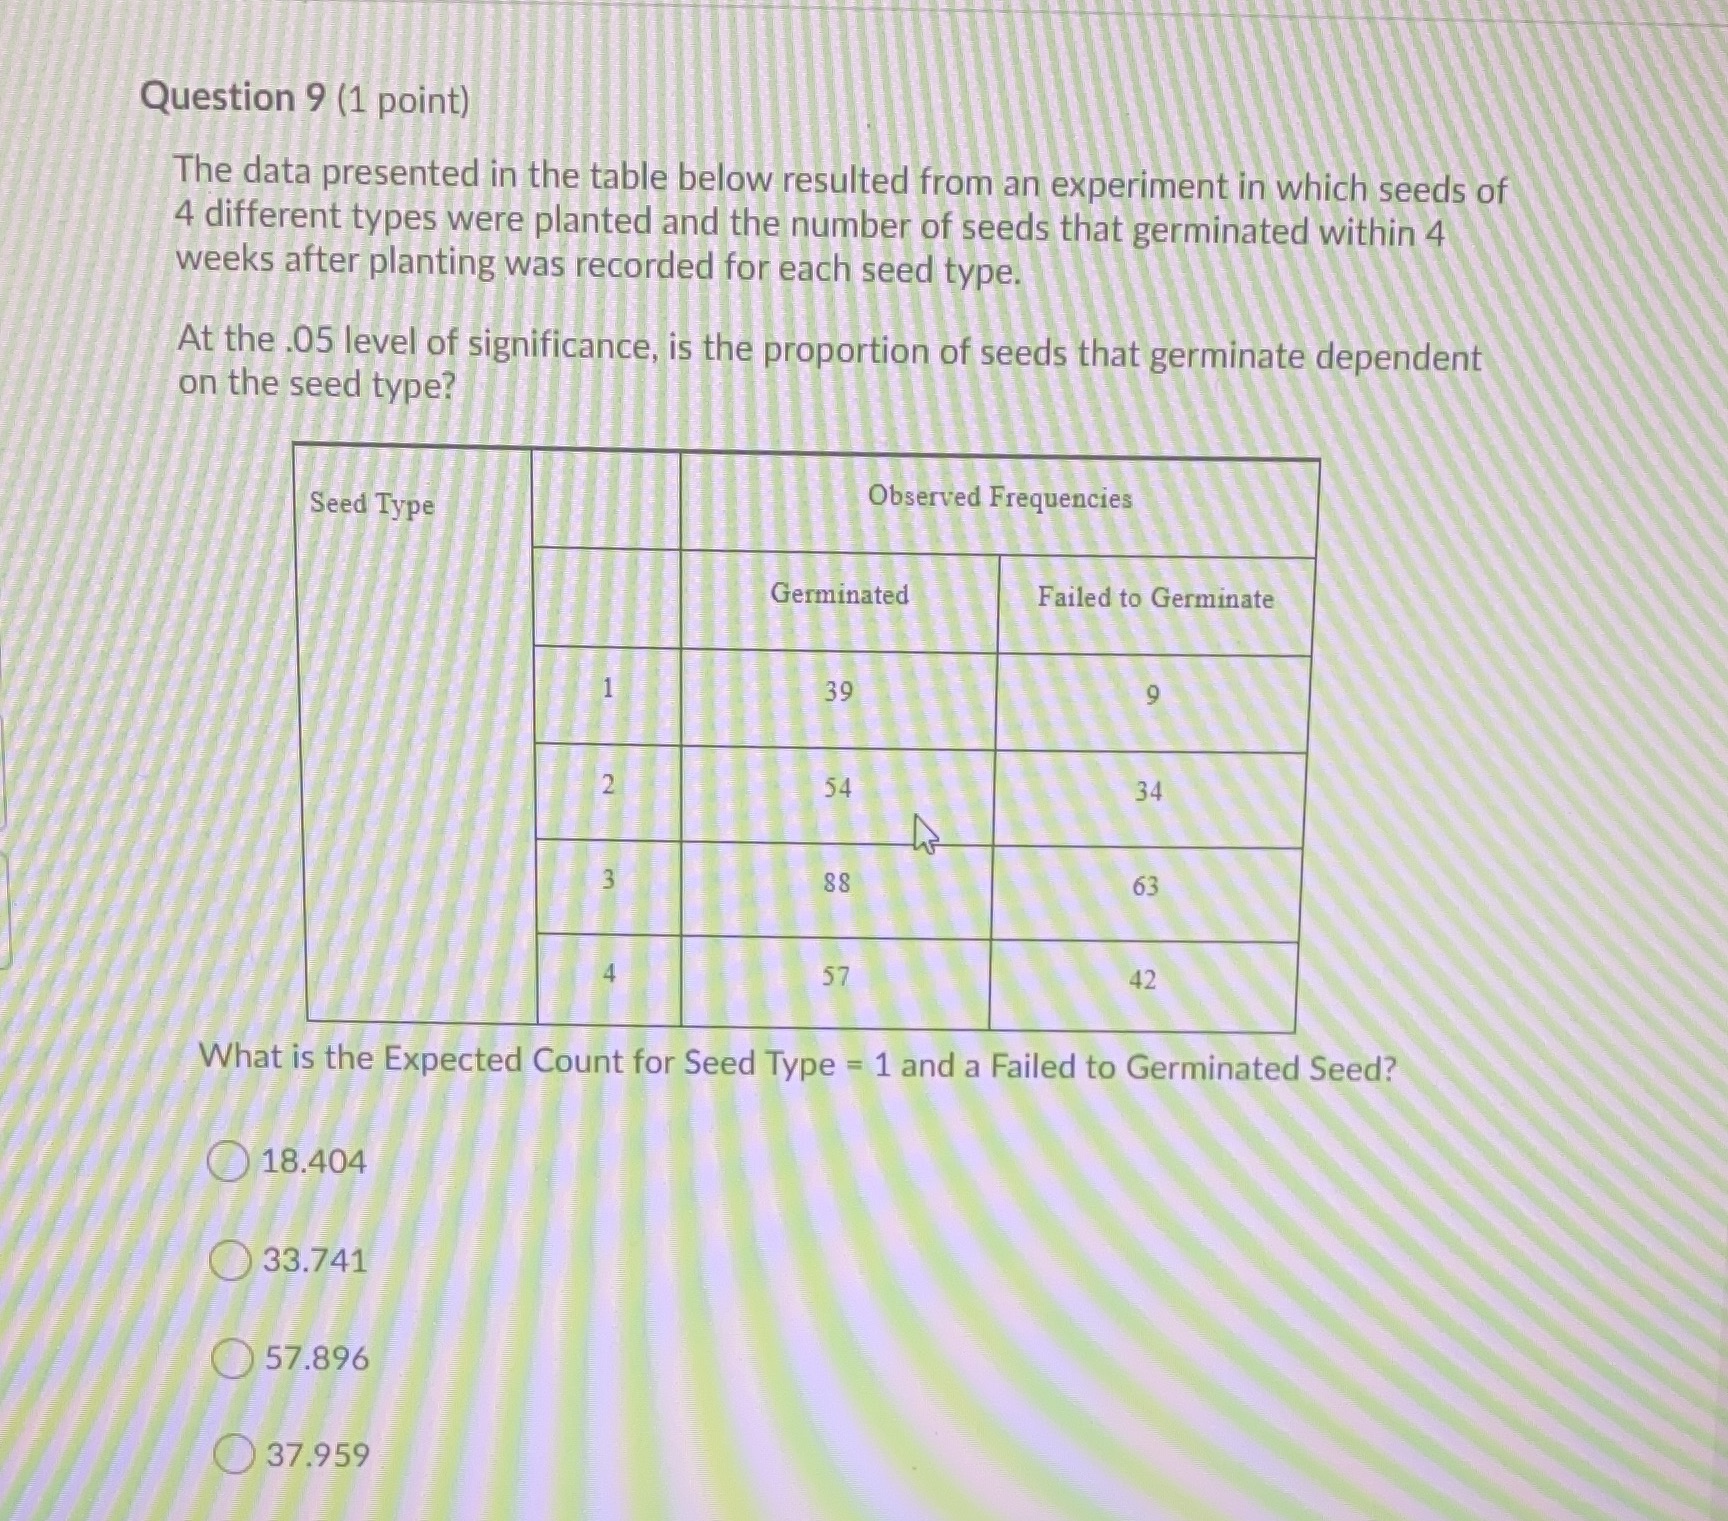
Question 9 (1 point) The data presented in the table below resulted from an experiment in which seeds of 4 different types were planted and the number of seeds that germinated within 4 weeks after planting was recorded for each seed type At the .05 level of significance, is the proportion of seeds that germinate dependent on the seed type? Seed Type Observed Frequencies Germinated Failed to Germinate 39 9 2 54 34 88 63 57 42 What is the Expected Count for Seed Type = 1 and a Failed to Germinated Seed? 18.404 33.741 57.896 37.959
Step by Step Solution
There are 3 Steps involved in it

Get step-by-step solutions from verified subject matter experts