

Question: The data reported below provides their age, reported in years, for all respondents. a) Construct a frequency distribution to display these data (in so doing,
The data reported below provides their age, reported in years, for all respondents.
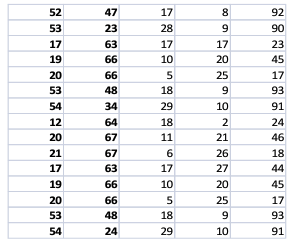
a) Construct a frequency distribution to display these data (in so doing, use 10 year intervals, i.e. 0-9; 10-19; 20-29; 30-39; 40-49; 50-59; 60-69; 70-79; 80-89; 90-99).1 b) Add columns to the table to display the percentage distribution, cumulative frequency. distribution, and cumulative percentage distribution c) In what category do we find the median? The mode?..1 d) Write a few sentences summarizing the distribution of scores. .1
Step by Step Solution
There are 3 Steps involved in it
1 Expert Approved Answer
Step: 1 Unlock

Question Has Been Solved by an Expert!
Get step-by-step solutions from verified subject matter experts
Step: 2 Unlock
Step: 3 Unlock