

Question: The data represent the results for a test for a certain disease. Assume one individual from the group is randomly selected. Find the probability of
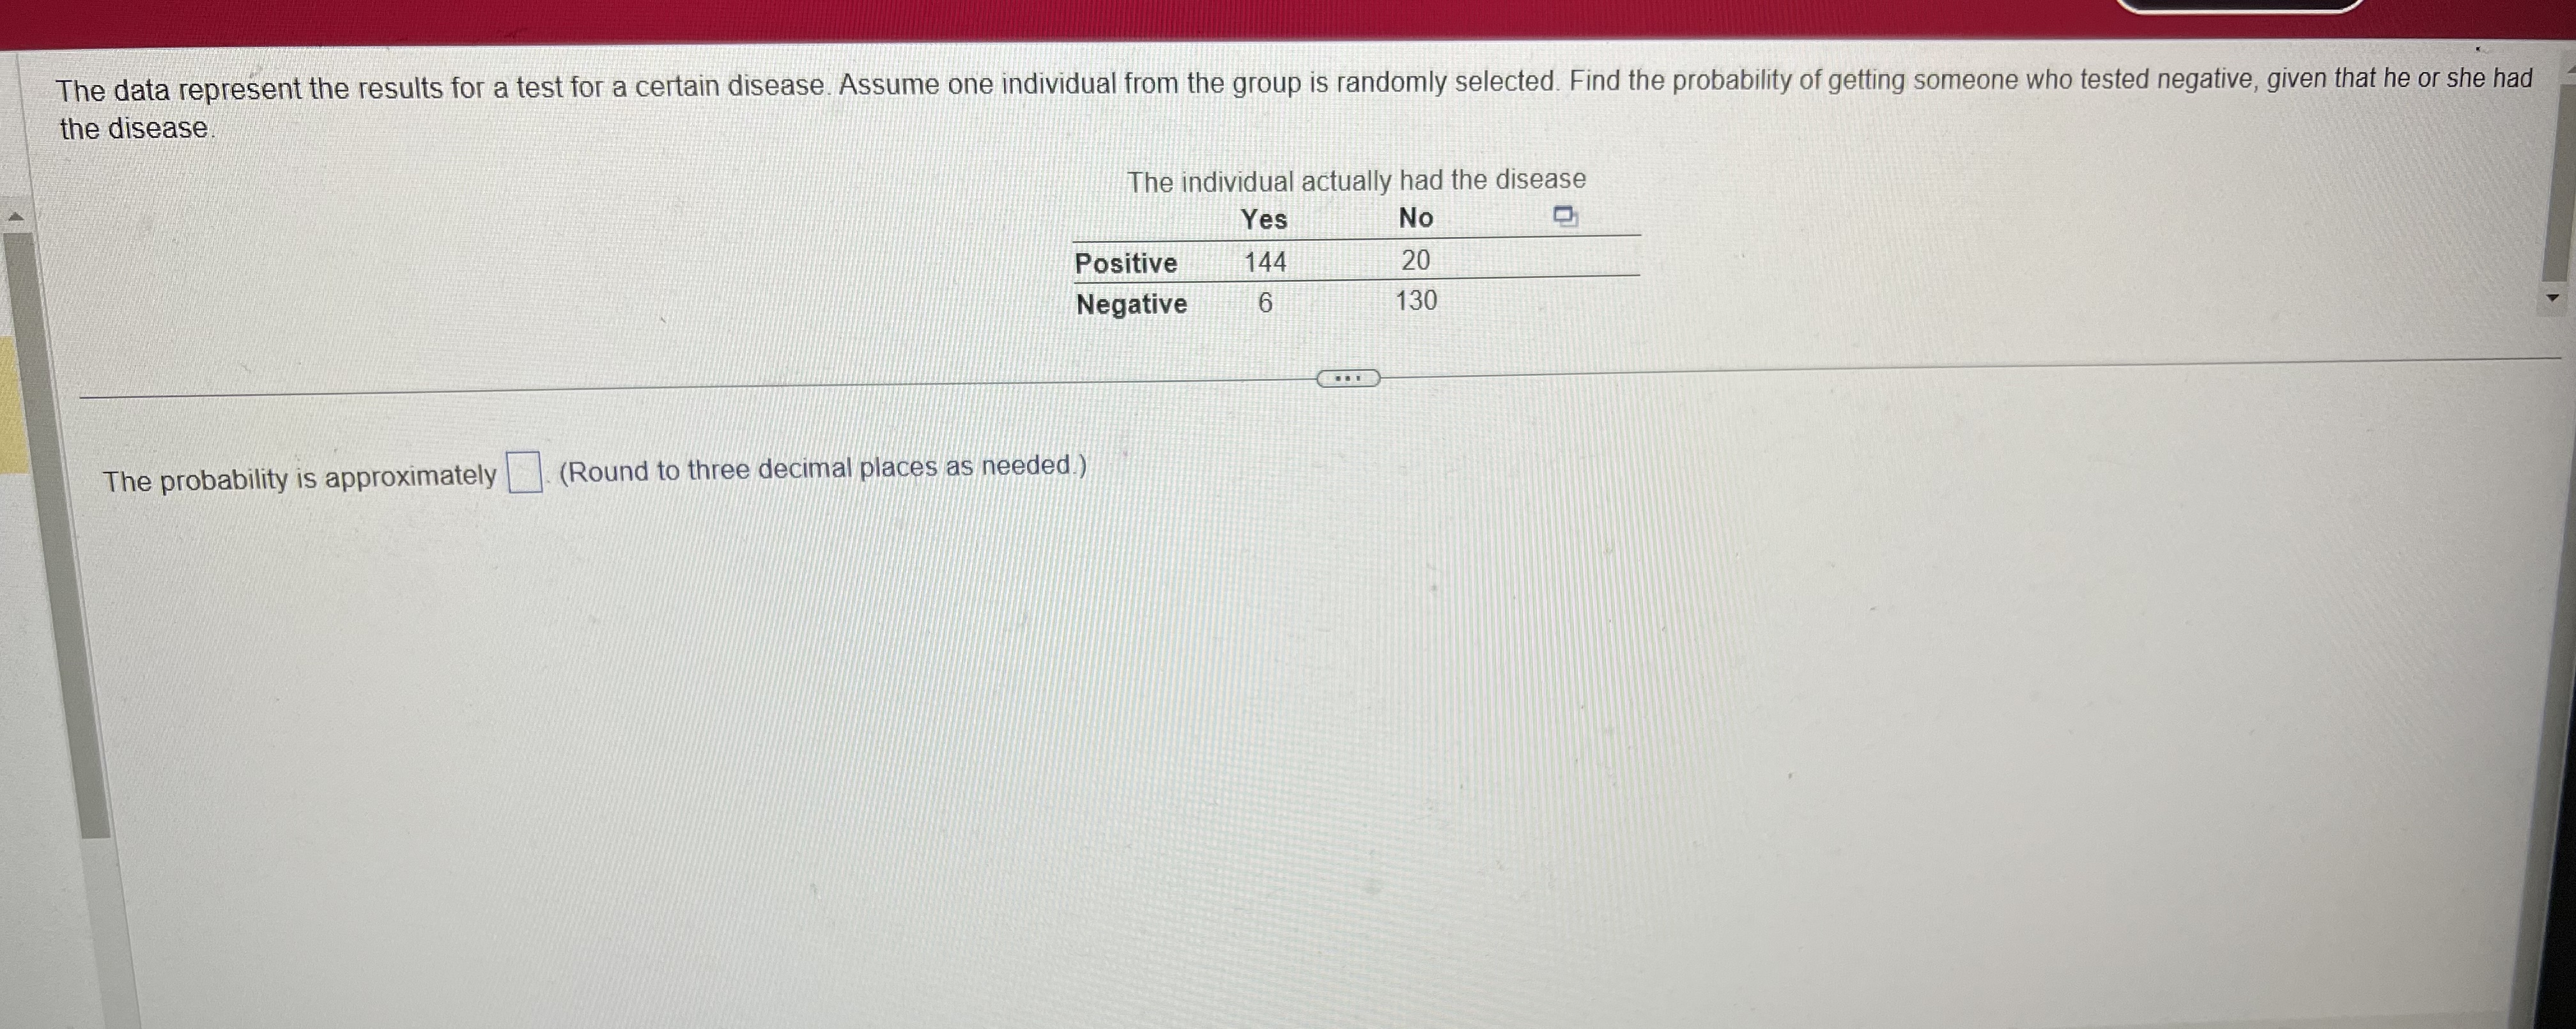
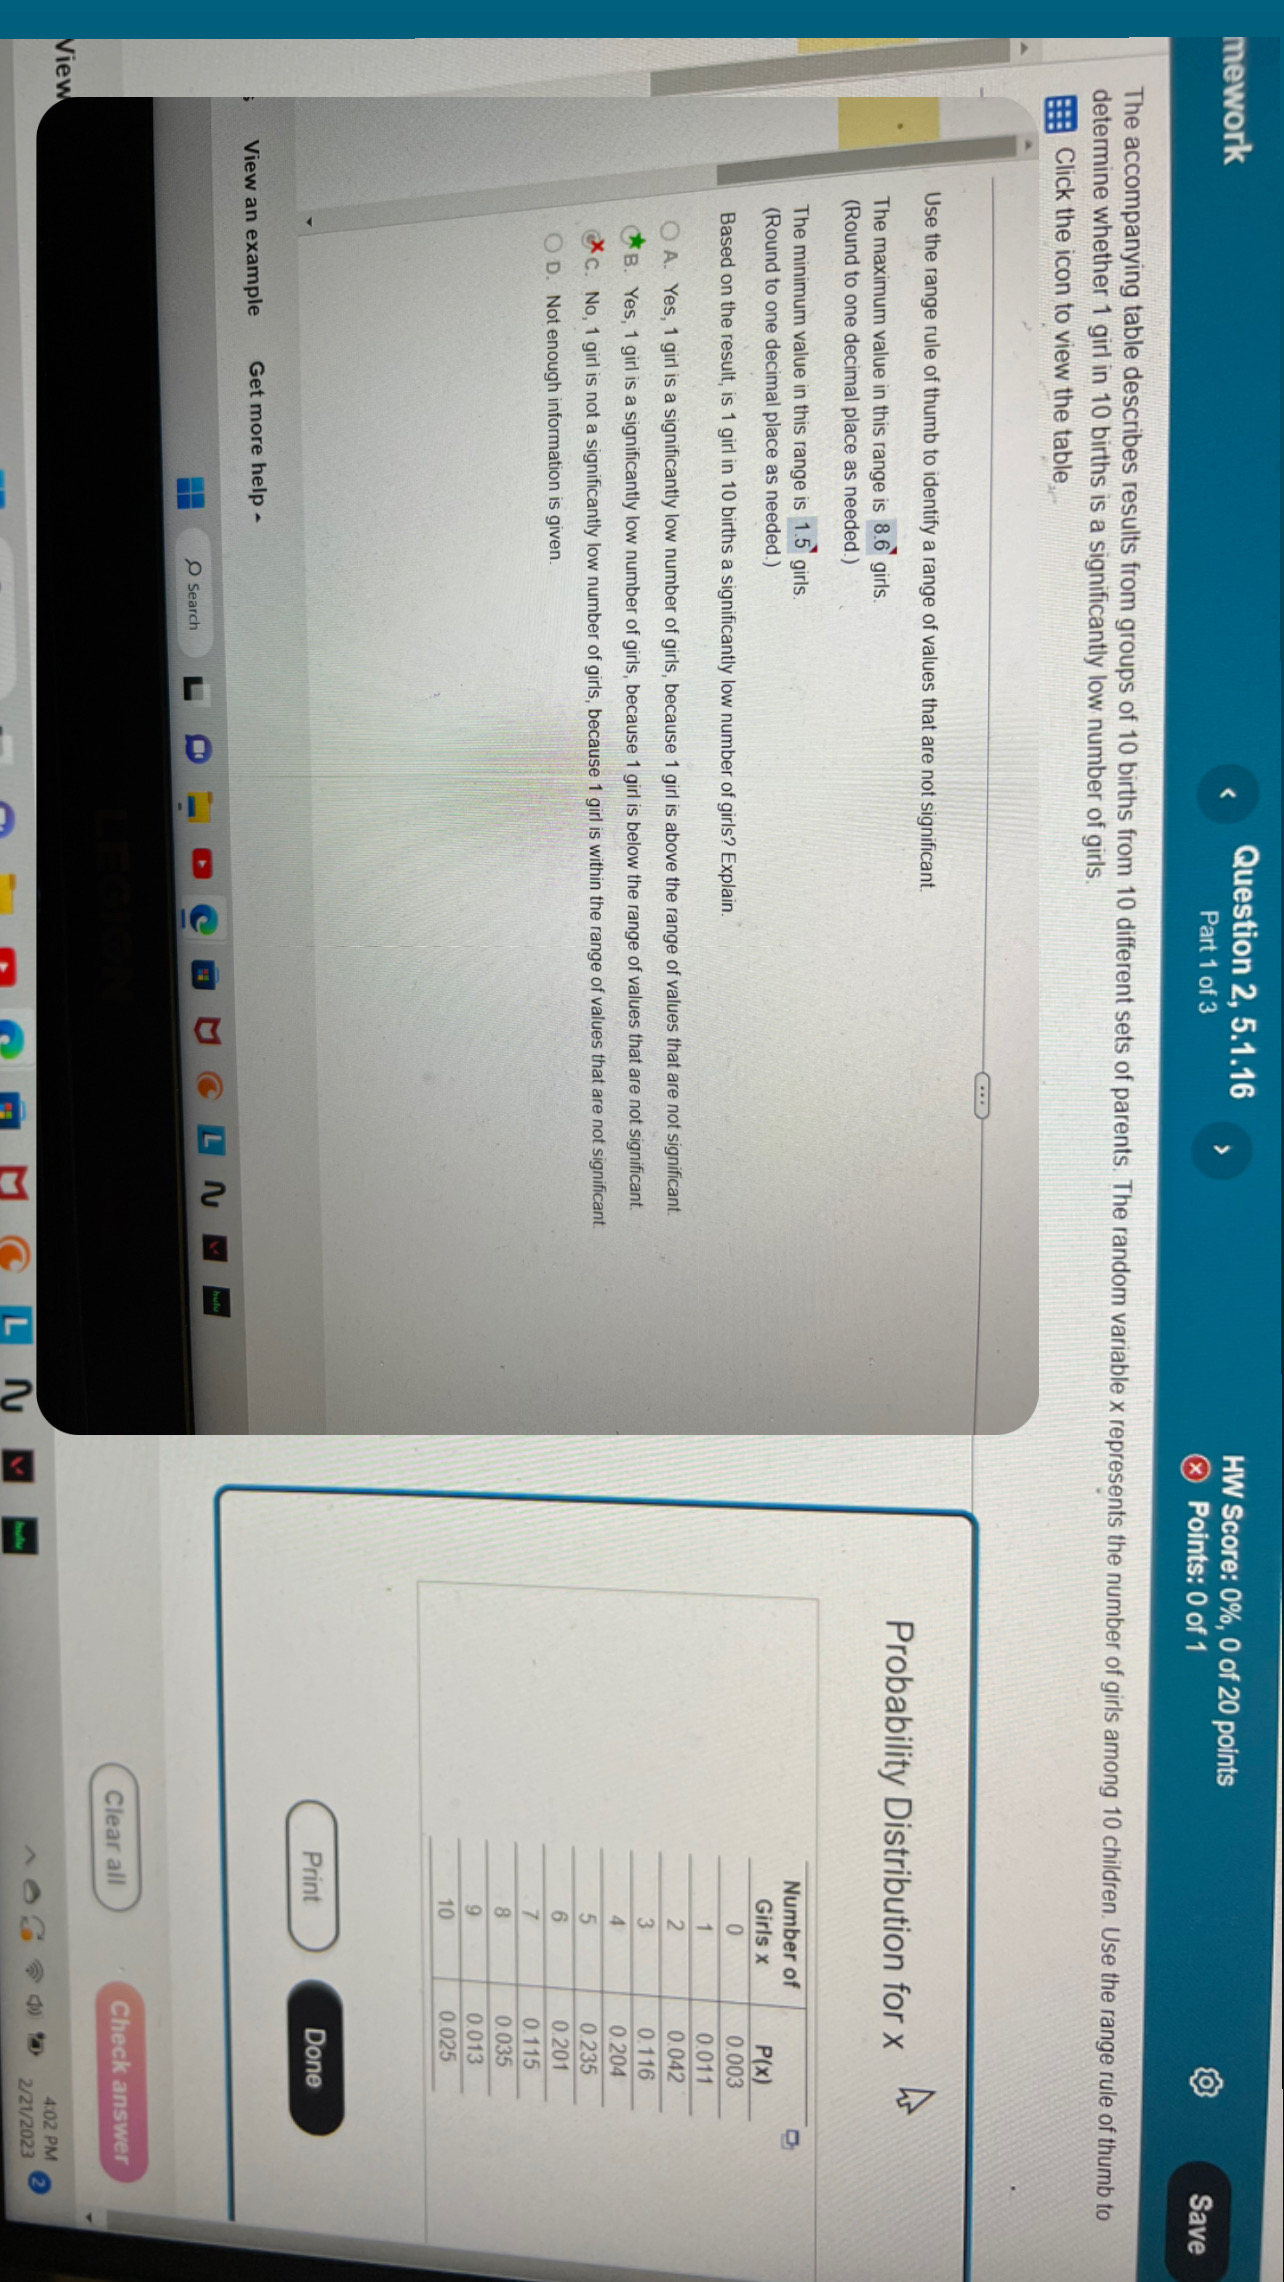
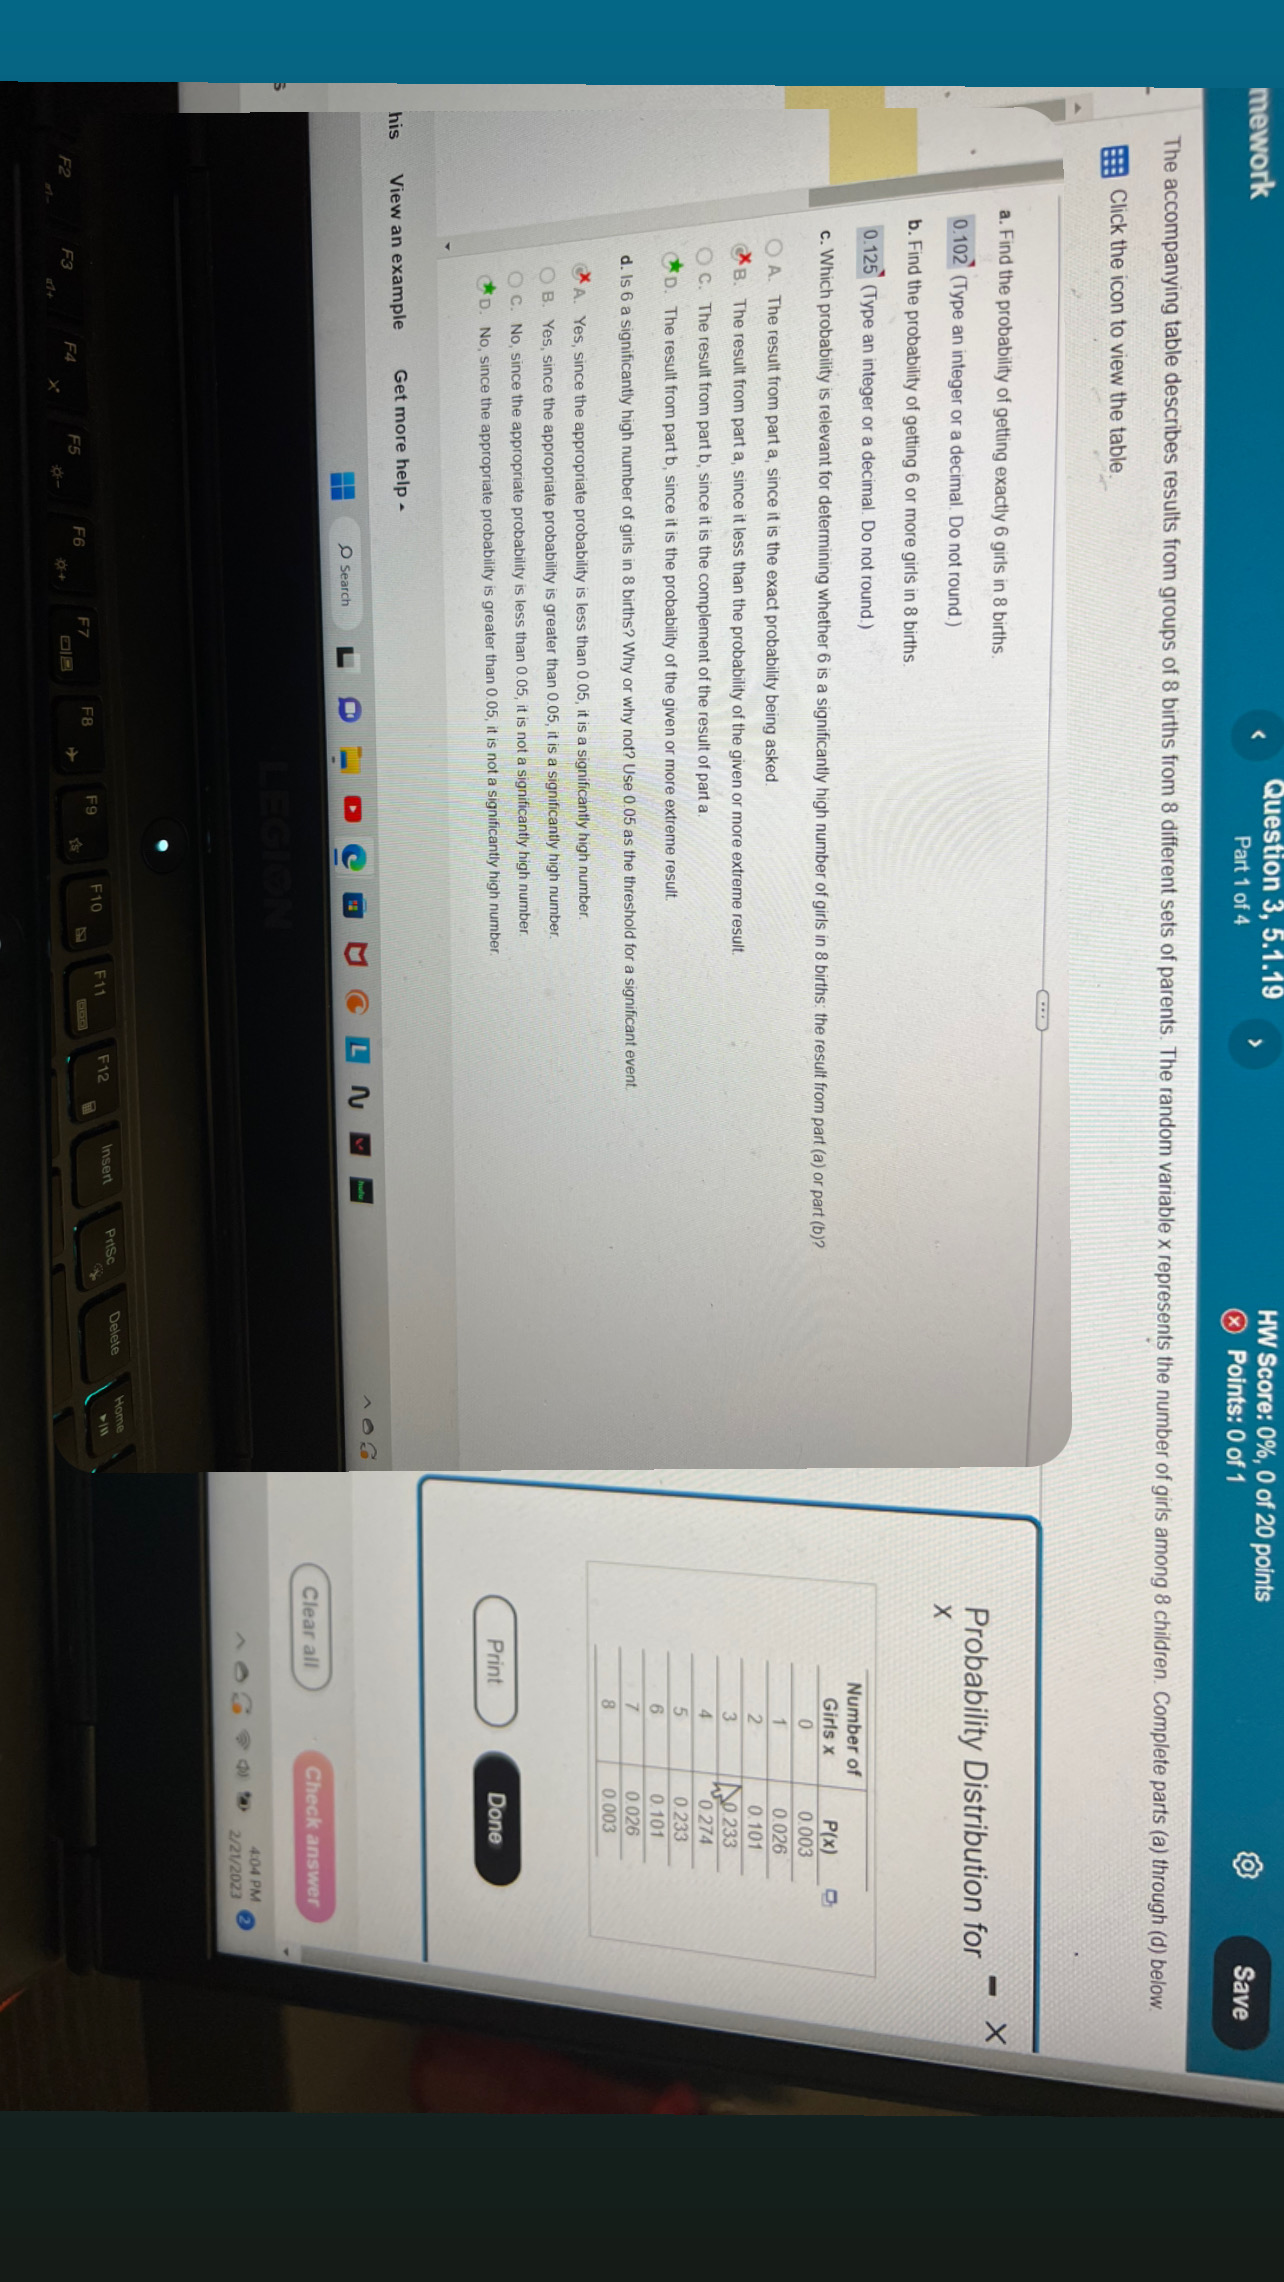
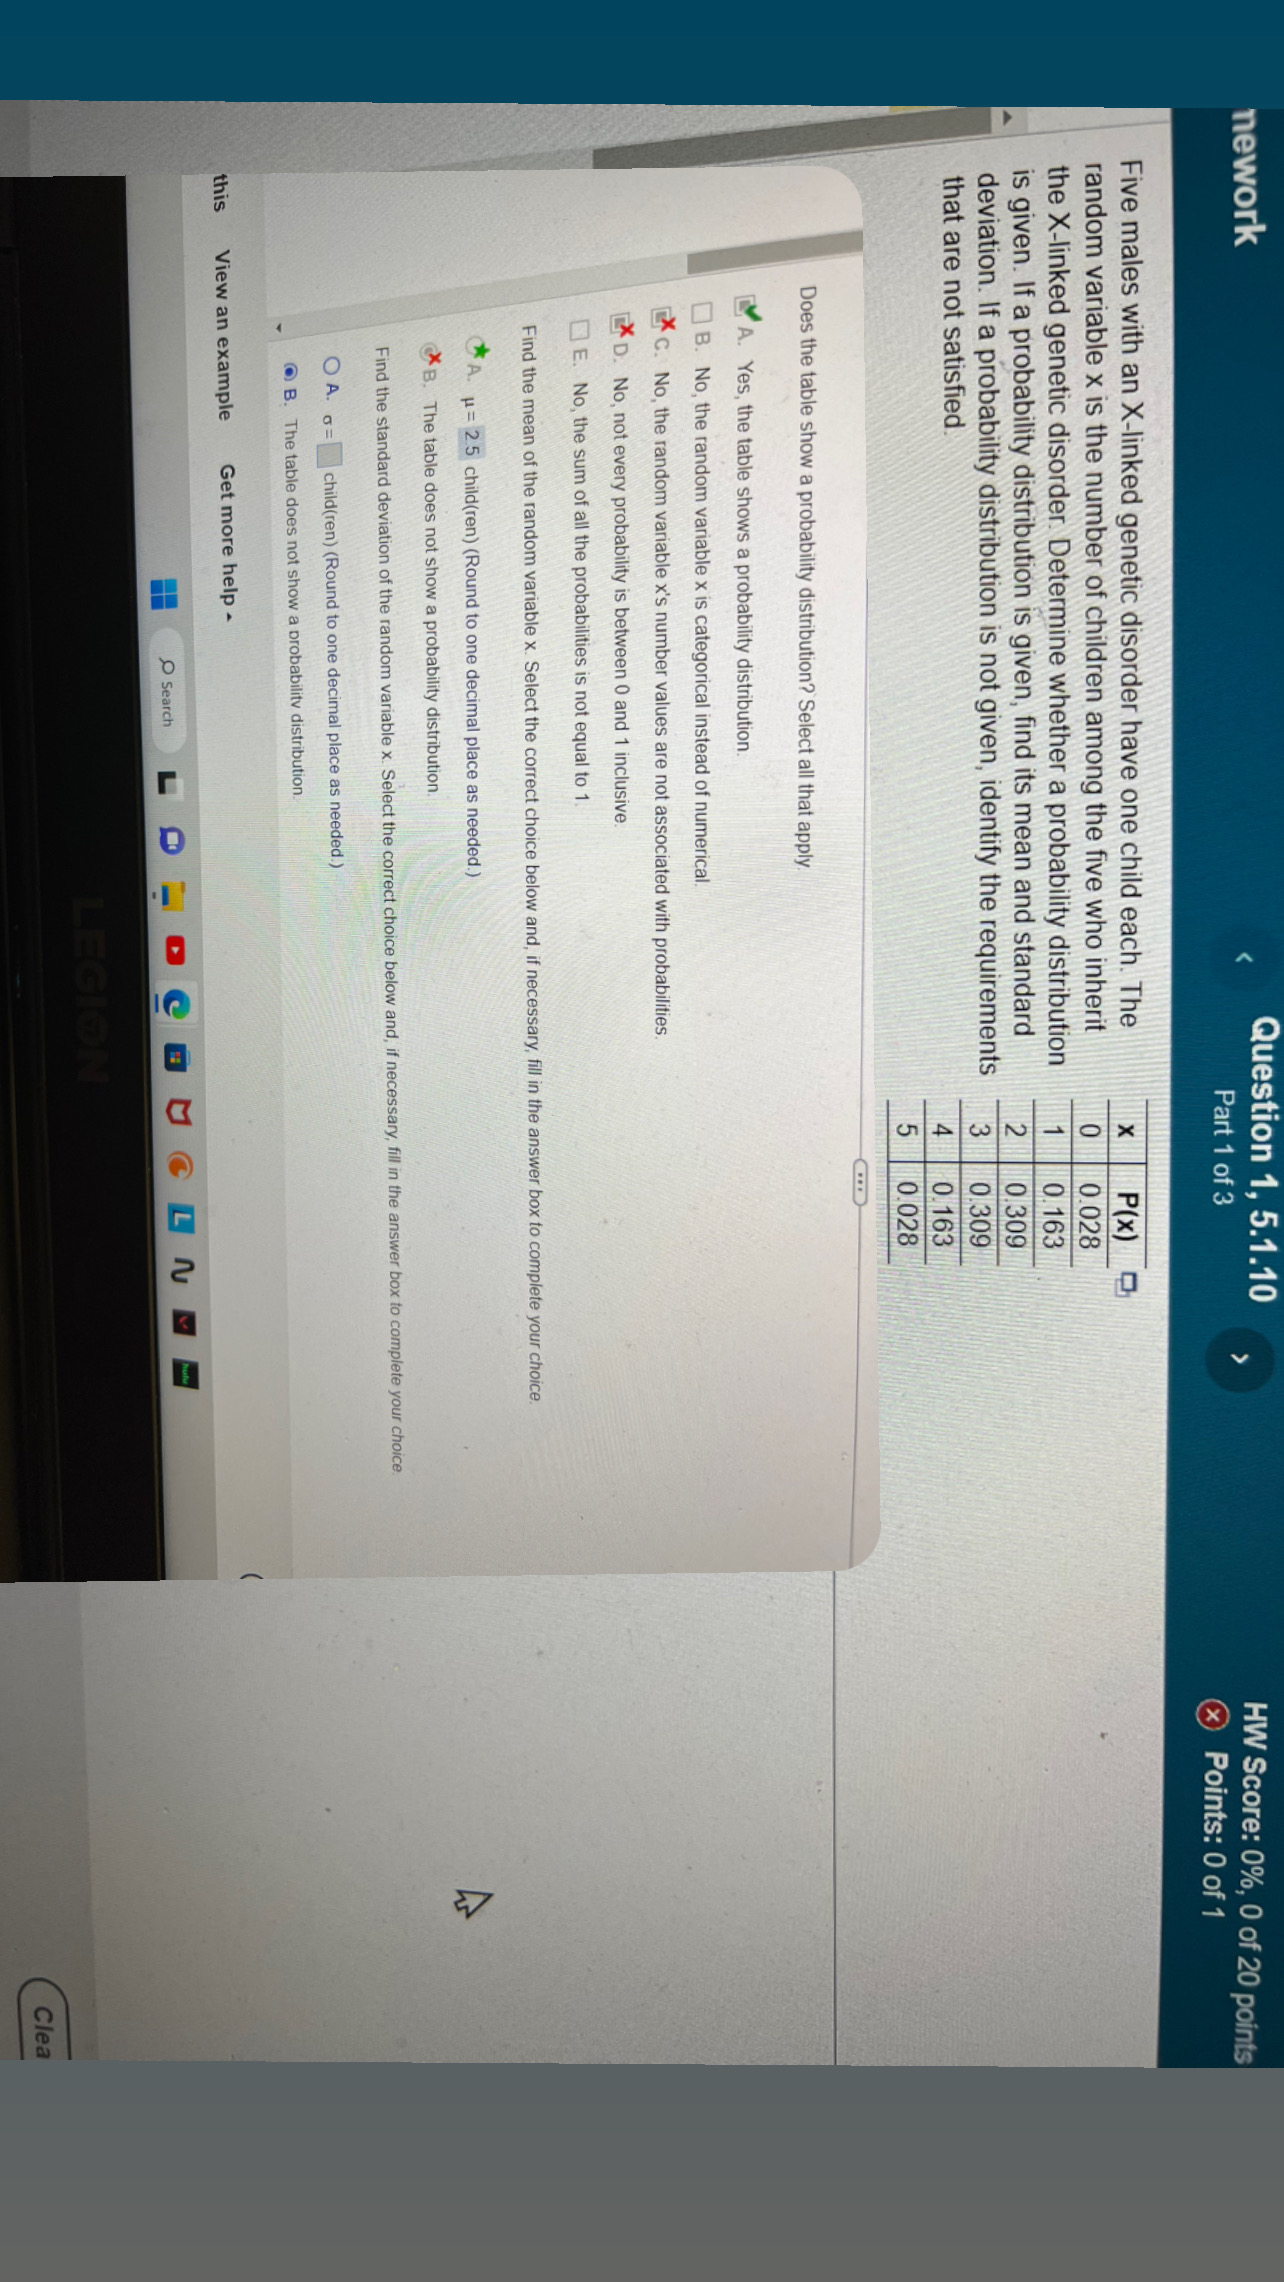
The data represent the results for a test for a certain disease. Assume one individual from the group is randomly selected. Find the probability of getting someone who tested negative, given that he or she had the disease The individual actually had the disease Yes No Positive 144 20 Negative 6 130 The probability is approximately (Round to three decimal places as needed.)mework Question 2, 5.1.16 HW Score: 0%, 0 of 20 points Part 1 of 3 & Points: 0 of 1 Save The accompanying table describes results from groups of 10 births from 10 different sets of parents. The random variable x represents the number of girls among 10 children. Use the range rule of thumb to determine whether 1 girl in 10 births is a significantly low number of girls. Click the icon to view the table, Use the range rule of thumb to identify a range of values that are not significant. The maximum value in this range is 8.6 girls. Probability Distribution for x (Round to one decimal place as needed.) The minimum value in this range is 1.5 girls. Number of (Round to one decimal place as needed.) Girls x P(x) Based on the result, is 1 girl in 10 births a significantly low number of girls? Explain. 0.003 0.011 A. Yes, 1 girl is a significantly low number of girls, because 1 girl is above the range of values that are not significant. 0.042 0.116 *B. Yes, 1 girl is a significantly low number of girls, because 1 girl is below the range of values that are not significant. 0.204 X C. No, 1 girl is not a significantly low number of girls, because 1 girl is within the range of values that are not significant. 0.235 O D. Not enough information is given. 0.201 0.115 0.035 0.013 0.025 Print Done View an example Get more help - Search L O -D C B UC LNMM Clear all Check answer View 4:02 PM C L N 2/21/2023 2mework lestion 3, 5. HW Score: 0%, 0 of 20 points Part 1 of 4 Points: 0 of 1 Save The accompanying table describes results from groups of 8 births from 8 different sets of parents. The random variable x represents the number of girls among 8 children. Complete parts (a) through (d) below. Click the icon to view the table. a. Find the probability of getting exactly 6 girls in 8 births. X Probability Distribution for 0.102 (Type an integer or a decimal. Do not round.) X b. Find the probability of getting 6 or more girls in 8 births. 0.125 (Type an integer or a decimal. Do not round.) Number of C. Which probability is relevant for determining whether 6 is a significantly high number of girls in 8 births: the result from part (a) or part (b)? Girls x P(x) 0 0.003 0.026 A. The result from part a, since it is the exact probability being asked. 0.101 X B. The result from part a, since it less than the probability of the given or more extreme result. 0.233 O C. The result from part b, since it is the complement of the result of part a. 0 274 0.233 *D. The result from part b, since it is the probability of the given or more extreme result. 0.101 d. Is 6 a significantly high number of girls in 8 births? Why or why not? Use 0.05 as the threshold for a significant event. 0.026 0.003 X A. Yes, since the appropriate probability is less than 0.05, it is a significantly high number. O B. Yes, since the appropriate probability is greater than 0.05, it is a significantly high number. C. No, since the appropriate probability is less than 0.05, it is not a significantly high number. *D. No, since the appropriate probability is greater than 0.05, it is not a significantly high number. Print Done his View an example Get more help - Search C B U CLNM Clear all Check answer 4:04 PM 2/21/2023 2 Delete Home Insert F10 F11 F12 Prise F7 F8 F9 F6 F2 F3 F4 F5nework Question 1, 5.1.10 HW Score: 0%, 0 of 20 points Part 1 of 3 x Points: 0 of 1 Five males with an X-linked genetic disorder have one child each. The X P(x) random variable x is the number of children among the five who inherit C 0.028 the X-linked genetic disorder Determine whether a probability distribution 0. 163 is given. If a probability distribution is given, find its mean and standard 1 0 309 deviation. If a probability distribution is not given, identify the requirements 0.309 that are not satisfied. + 0. 163 0.028 Does the table show a probability distribution? Select all that apply. LY A. Yes, the table shows a probability distribution. B. No, the random variable x is categorical instead of numerical. X C. No, the random variable x's number values are not associated with probabilities. X D. No, not every probability is between 0 and 1 inclusive. E. No, the sum of all the probabilities is not equal to 1. Find the mean of the random variable x. Select the correct choice below and, if necessary, fill in the answer box to complete your choice. A. u= 2.5 child(ren) (Round to one decimal place as needed.) X B. The table does not show a probability distribution. Find the standard deviation of the random variable x. Select the correct choice below and, if necessary, fill in the answer box to complete your choice. O A. .= child(ren) (Round to one decimal place as needed.) B. The table does not show a probability distribution. this View an example Get more help - Search LO -B C B UCLNM Clea
Step by Step Solution
There are 3 Steps involved in it

Get step-by-step solutions from verified subject matter experts