

Question: The data represent the time, in minutes, spent reading a political blog in a day. Construct a frequency distribution using 5 classes. In the table,
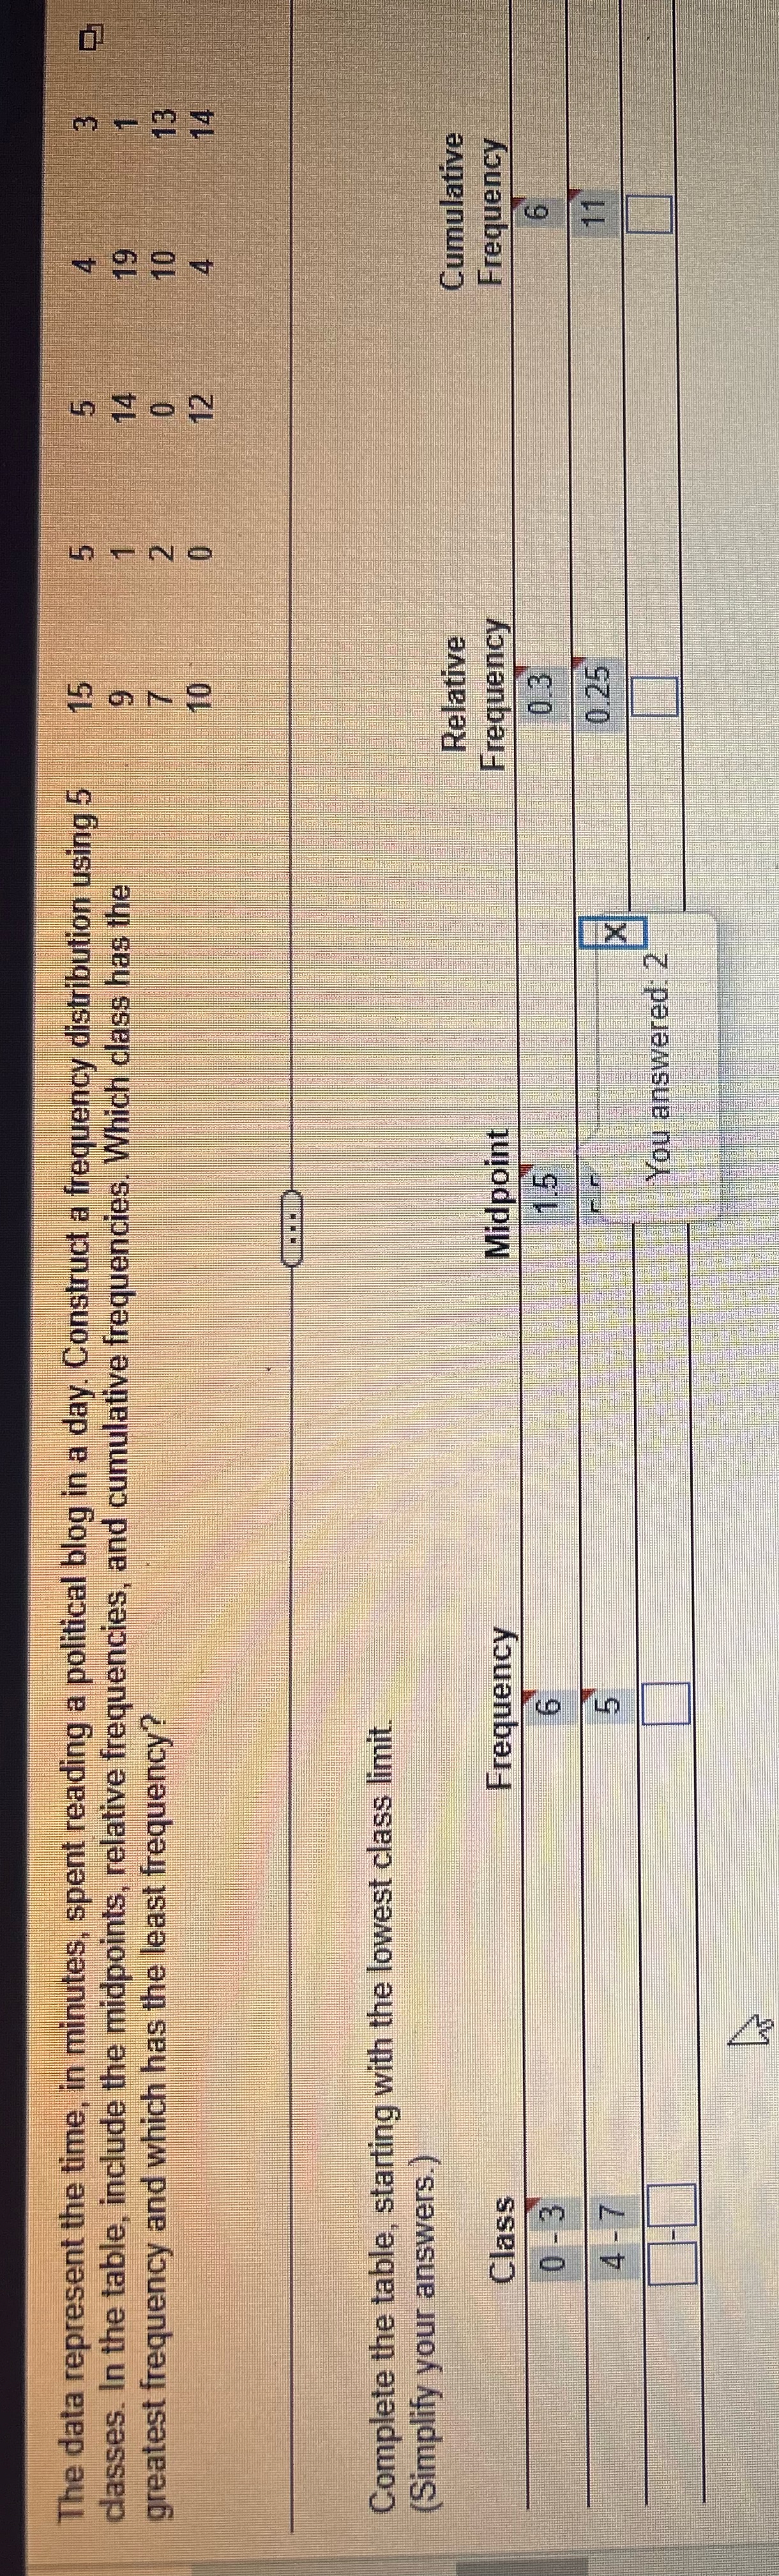
The data represent the time, in minutes, spent reading a political blog in a day. Construct a frequency distribution using 5 classes. In the table, include the midpoints, relative frequencies, and cumulative frequencies. Which class has the greatest frequency and which has the least frequency? Complete the table, starting with the lowest class limit (Simplify your answers.) Relative Cumulative Frequency Class Frequency Midpoint Frequency 0 - 3 0.25 4 -7 You answered: 2
Step by Step Solution
There are 3 Steps involved in it
1 Expert Approved Answer
Step: 1 Unlock

Question Has Been Solved by an Expert!
Get step-by-step solutions from verified subject matter experts
Step: 2 Unlock
Step: 3 Unlock