

Question: The data represent the time, in minutes, spent reading a political blog in a day. Construct a frequency 0 21 27 38 0 distribution using
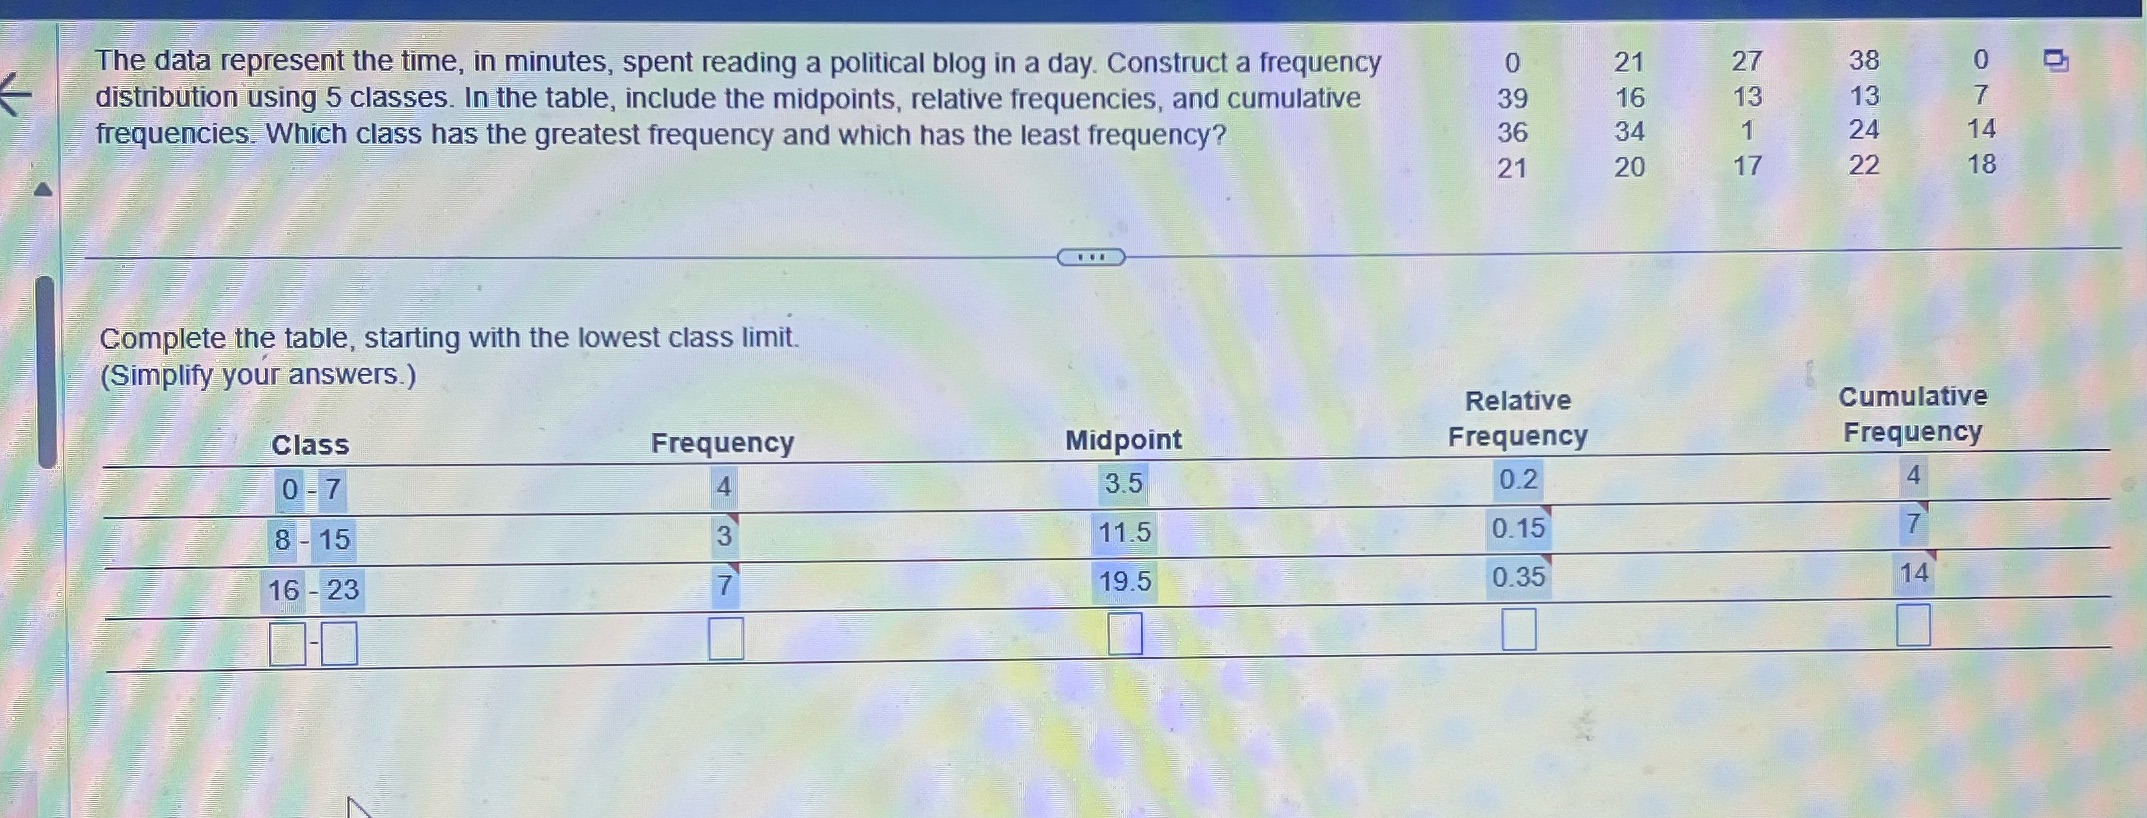
The data represent the time, in minutes, spent reading a political blog in a day. Construct a frequency 0 21 27 38 0 distribution using 5 classes. In the table, include the midpoints, relative frequencies, and cumulative 39 16 13 13 frequencies. Which class has the greatest frequency and which has the least frequency? 36 34 1 24 14 21 20 17 22 18 Complete the table, starting with the lowest class limit. (Simplify your answers.) Relative Cumulative Class Frequency Midpoint Frequency Frequency 0 -7 4 3.5 0.2 4 8 - 15 11.5 0.15 7 16 -23 19.5 0.35 14
Step by Step Solution
There are 3 Steps involved in it
1 Expert Approved Answer
Step: 1 Unlock

Question Has Been Solved by an Expert!
Get step-by-step solutions from verified subject matter experts
Step: 2 Unlock
Step: 3 Unlock