

Question: The data represents the body mass index (BMI) values 17 7 335 268 235 231 0 for 20 females. Construct a frequency distribution 28.3 224

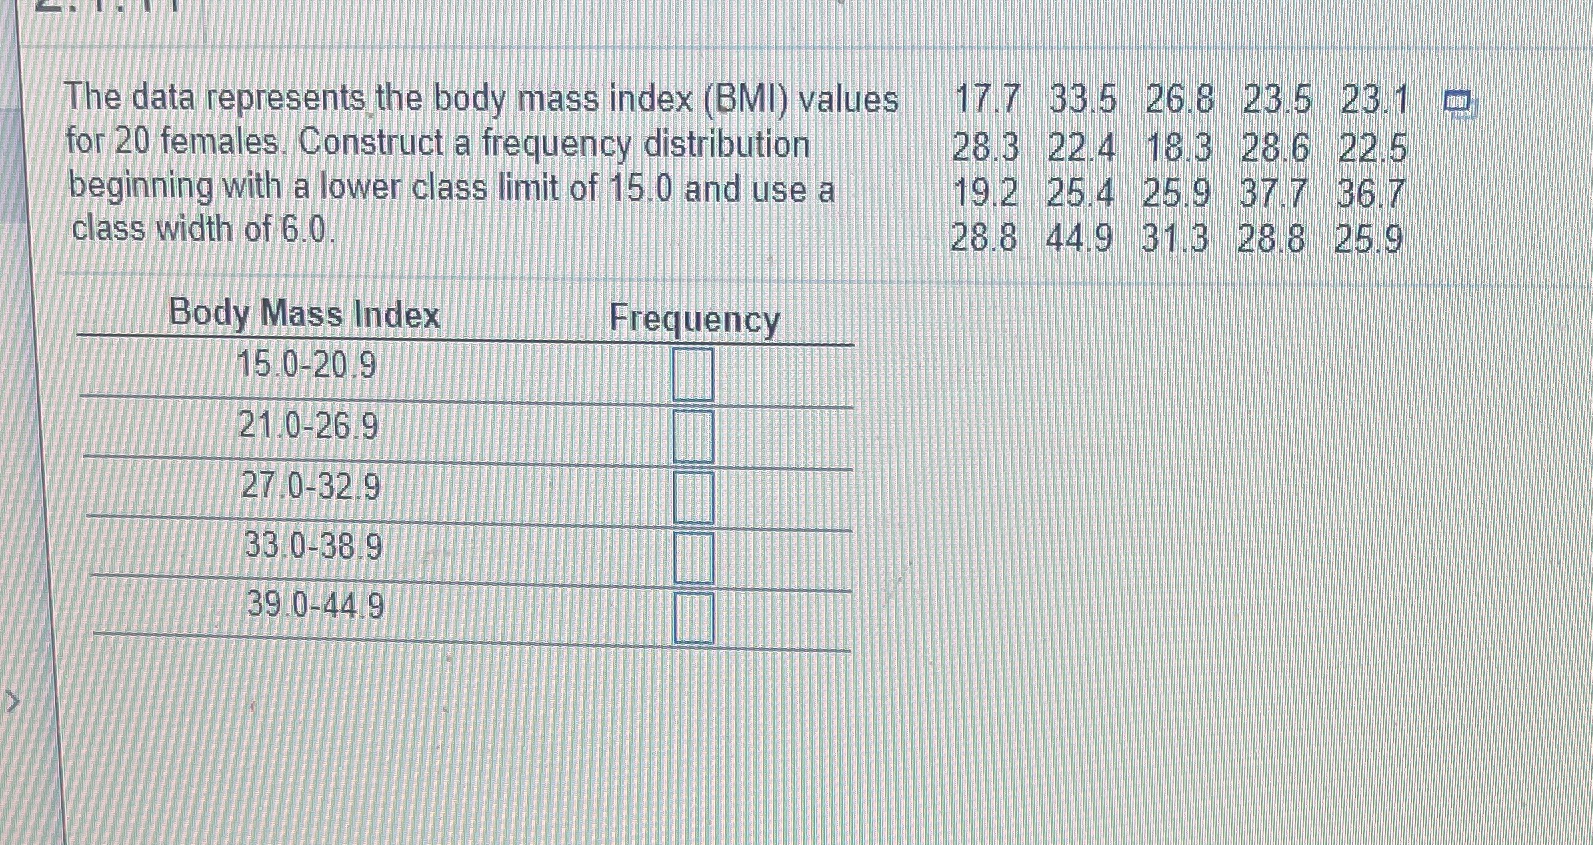
The data represents the body mass index (BMI) values 17 7 335 268 235 231 0 for 20 females. Construct a frequency distribution 28.3 224 18 3 286 22.5 beginning with a lower class limit of 15.0 and use a 19 2 254 25.9 37 7 36 7 class width of 6.0 28.8 449 31 3 28 8 259 Body Mass Index Frequency 15 0-20.9 21.0-26.9 27 0-32.9 33 0-38.9 39 0-44 9
Step by Step Solution
There are 3 Steps involved in it
1 Expert Approved Answer
Step: 1 Unlock

Question Has Been Solved by an Expert!
Get step-by-step solutions from verified subject matter experts
Step: 2 Unlock
Step: 3 Unlock