

Question: The data set are given in pictures below, Please use MATLAB to solve. Thanks for helping 2. You are analyzing a dataset, PolyData.mat, that contains
The data set are given in pictures below, Please use MATLAB to solve. Thanks for helping 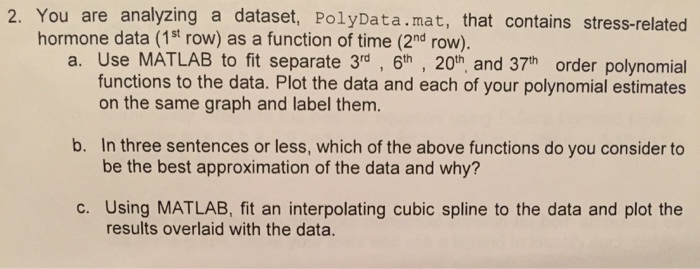
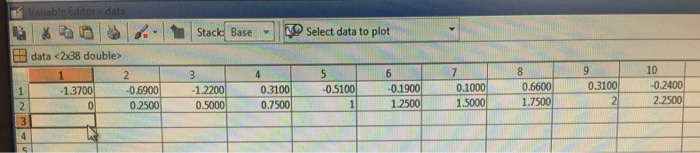
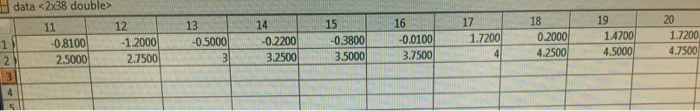
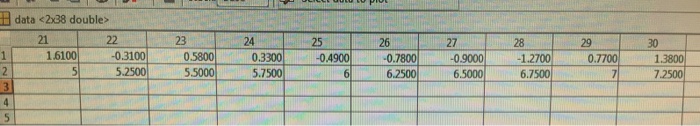
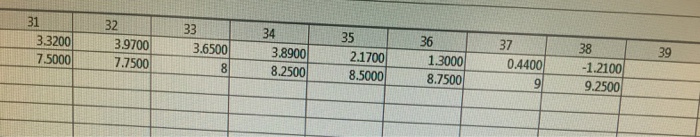
2. You are analyzing a dataset, PolyData.mat, that contains stress-related hormone data (1st row) as a function of time (2nd row) a. Use MATLAB to fit separate 3 th 20th. and 37th order polynomial functions to the data. Plot the data and each of your polynomial estimates on the same graph and label them. b. In three sentences or less, which of the above functions do you consider to be the best approximation of the data and why? c. Using MATLAB, fit an interpolating cubic spline to the data and plot the results overlaid with the data
Step by Step Solution
There are 3 Steps involved in it
1 Expert Approved Answer
Step: 1 Unlock

Question Has Been Solved by an Expert!
Get step-by-step solutions from verified subject matter experts
Step: 2 Unlock
Step: 3 Unlock