

Question: The data set below contains 2005 data for 118 countries. The variables are the following: GDP: GDP per capita measure in US dollars and adjusted
The data set below contains 2005 data for 118 countries. The variables are the following:
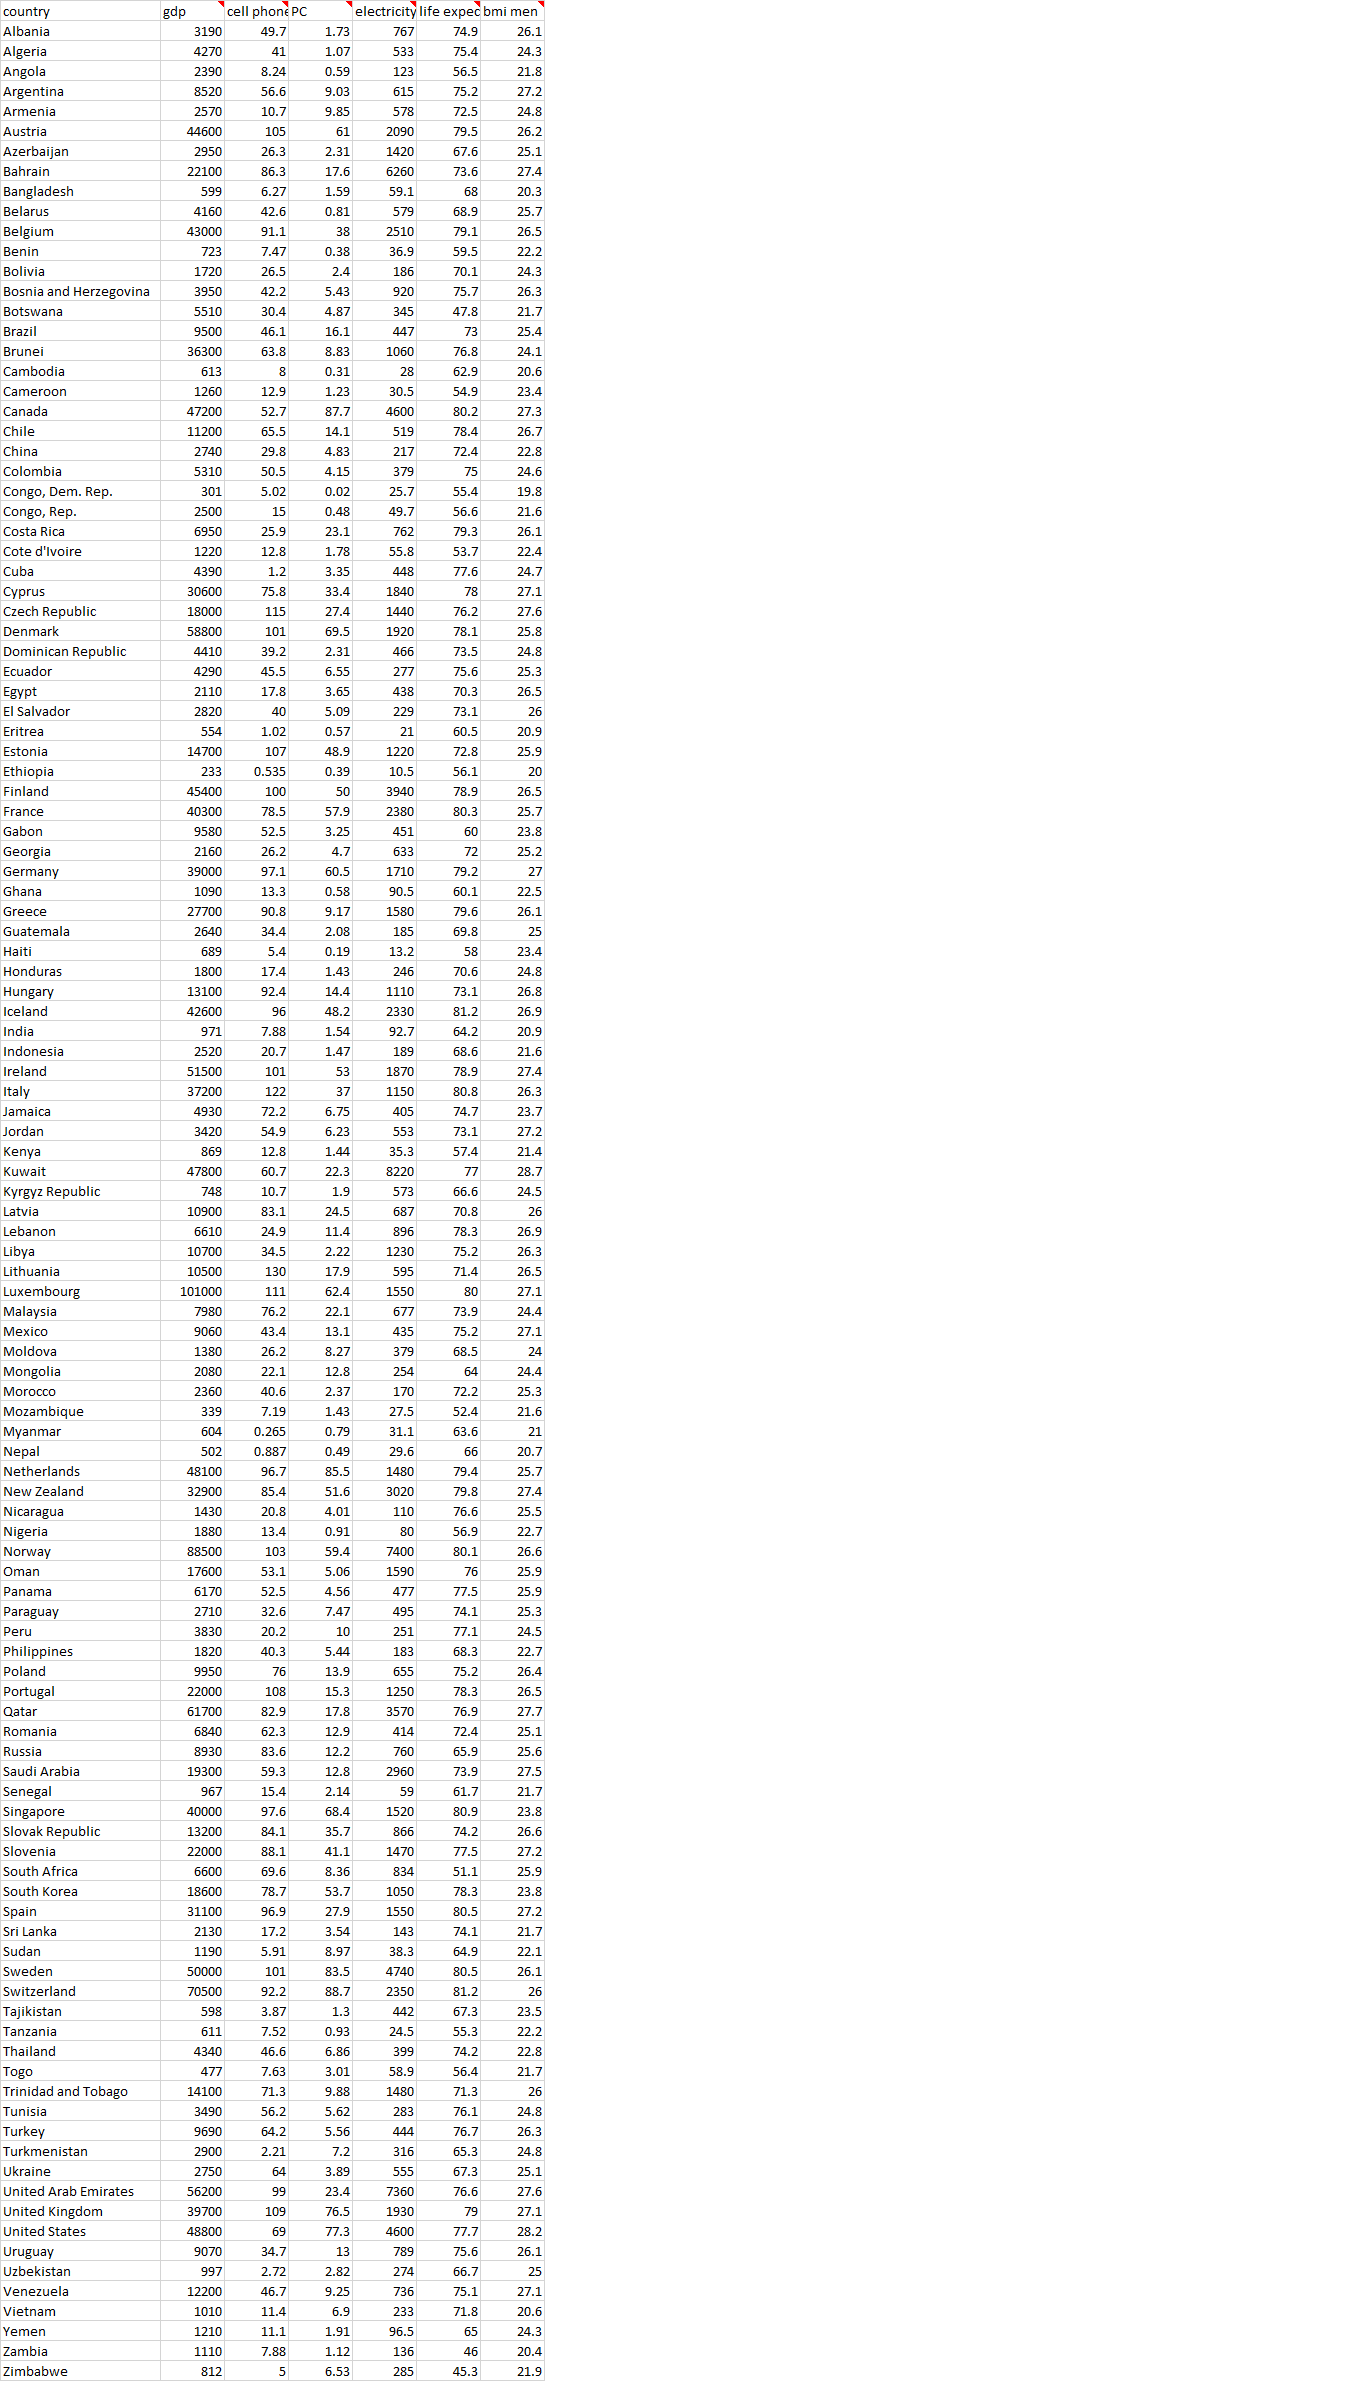
GDP: GDP per capita measure in US dollars and adjusted for inflation
Cell phone: Number of cells phones per 100 people
PC: Number of PCs per 100 people
electricity: Residential electricity use per person
life expectancy: Life expectancy in years
bmi men: Body mass index of males
You are interested in possible relationships between these variables. In particular, you are interested in how per capita GDP is related to the other variables.
1. Need to create scatterplots for GDP per capita and each of the other variables.
2. Needs to Calculate the correlation between each pair of variables.
3.Based on the results, which variables are most strongly related to per capita GDP?
4.Intuitively, wealthier countries generally have better access to health care, which in turn should increase life expectancy. Using your results from above, how would you explain the relatively low correlation between GDP per capita and life expectancy?
5. Needs 2 strengths and 2 limitations of correlations. ( About 1 -2 sentences on both of them )

Step by Step Solution
There are 3 Steps involved in it

Get step-by-step solutions from verified subject matter experts