

Question: The data set in this question contains the 2000 Standard and Poor's currency rating (C) for 31 countries, along with the debt service ratio (D)
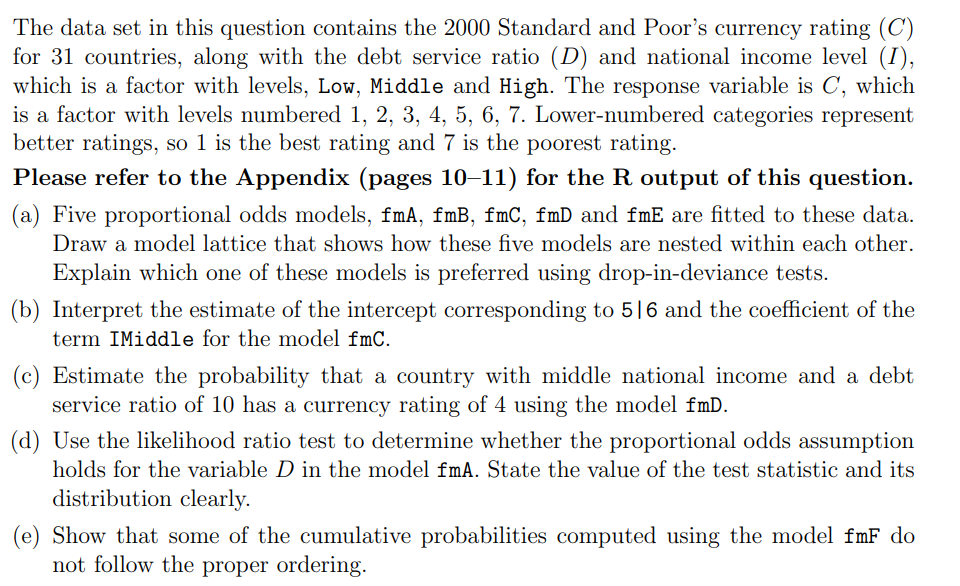
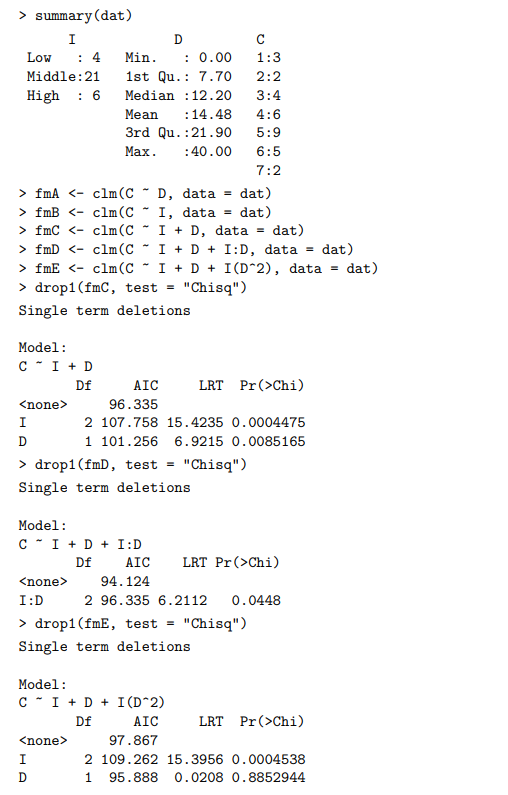
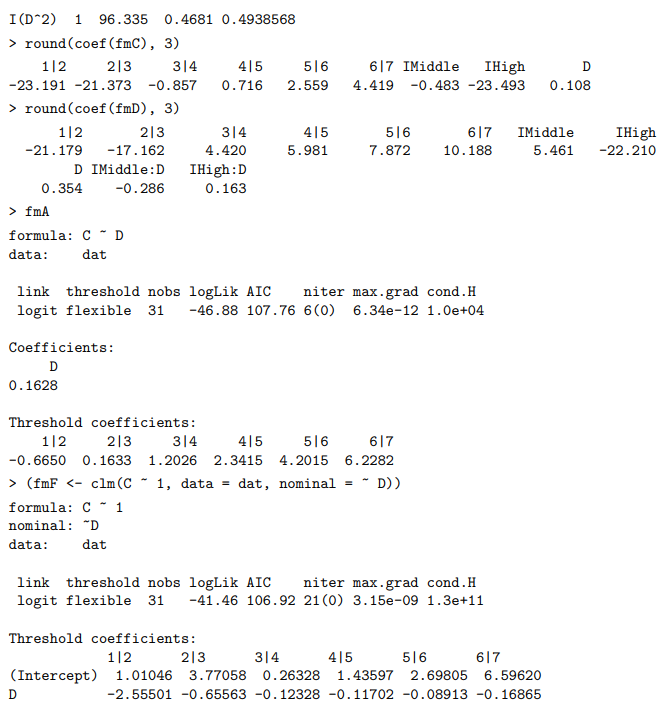
The data set in this question contains the 2000 Standard and Poor's currency rating (C) for 31 countries, along with the debt service ratio (D) and national income level (I), which is a factor with levels, Low, Middle and High. The response variable is C, which is a factor with levels numbered 1,2,3,4,5,6,7. Lower-numbered categories represent better ratings, so 1 is the best rating and 7 is the poorest rating. Please refer to the Appendix (pages 10-11) for the R output of this question. (a) Five proportional odds models, fmA, fmB, fmC, fmD and fmE are fitted to these data. Draw a model lattice that shows how these five models are nested within each other. Explain which one of these models is preferred using drop-in-deviance tests. (b) Interpret the estimate of the intercept corresponding to 56 and the coefficient of the term IMiddle for the model fmC. (c) Estimate the probability that a country with middle national income and a debt service ratio of 10 has a currency rating of 4 using the model fmD. (d) Use the likelihood ratio test to determine whether the proportional odds assumption holds for the variable D in the model fmA. State the value of the test statistic and its distribution clearly. (e) Show that some of the cumulative probabilities computed using the model fmF do not follow the proper ordering. Threshold coefficients: The data set in this question contains the 2000 Standard and Poor's currency rating (C) for 31 countries, along with the debt service ratio (D) and national income level (I), which is a factor with levels, Low, Middle and High. The response variable is C, which is a factor with levels numbered 1,2,3,4,5,6,7. Lower-numbered categories represent better ratings, so 1 is the best rating and 7 is the poorest rating. Please refer to the Appendix (pages 10-11) for the R output of this question. (a) Five proportional odds models, fmA, fmB, fmC, fmD and fmE are fitted to these data. Draw a model lattice that shows how these five models are nested within each other. Explain which one of these models is preferred using drop-in-deviance tests. (b) Interpret the estimate of the intercept corresponding to 56 and the coefficient of the term IMiddle for the model fmC. (c) Estimate the probability that a country with middle national income and a debt service ratio of 10 has a currency rating of 4 using the model fmD. (d) Use the likelihood ratio test to determine whether the proportional odds assumption holds for the variable D in the model fmA. State the value of the test statistic and its distribution clearly. (e) Show that some of the cumulative probabilities computed using the model fmF do not follow the proper ordering. Threshold coefficients
Step by Step Solution
There are 3 Steps involved in it

Get step-by-step solutions from verified subject matter experts