

Question: The data set provided in the excel sheet represents the number of weekly visitor the LIVLAND amusement park for year 2 0 2 2 .
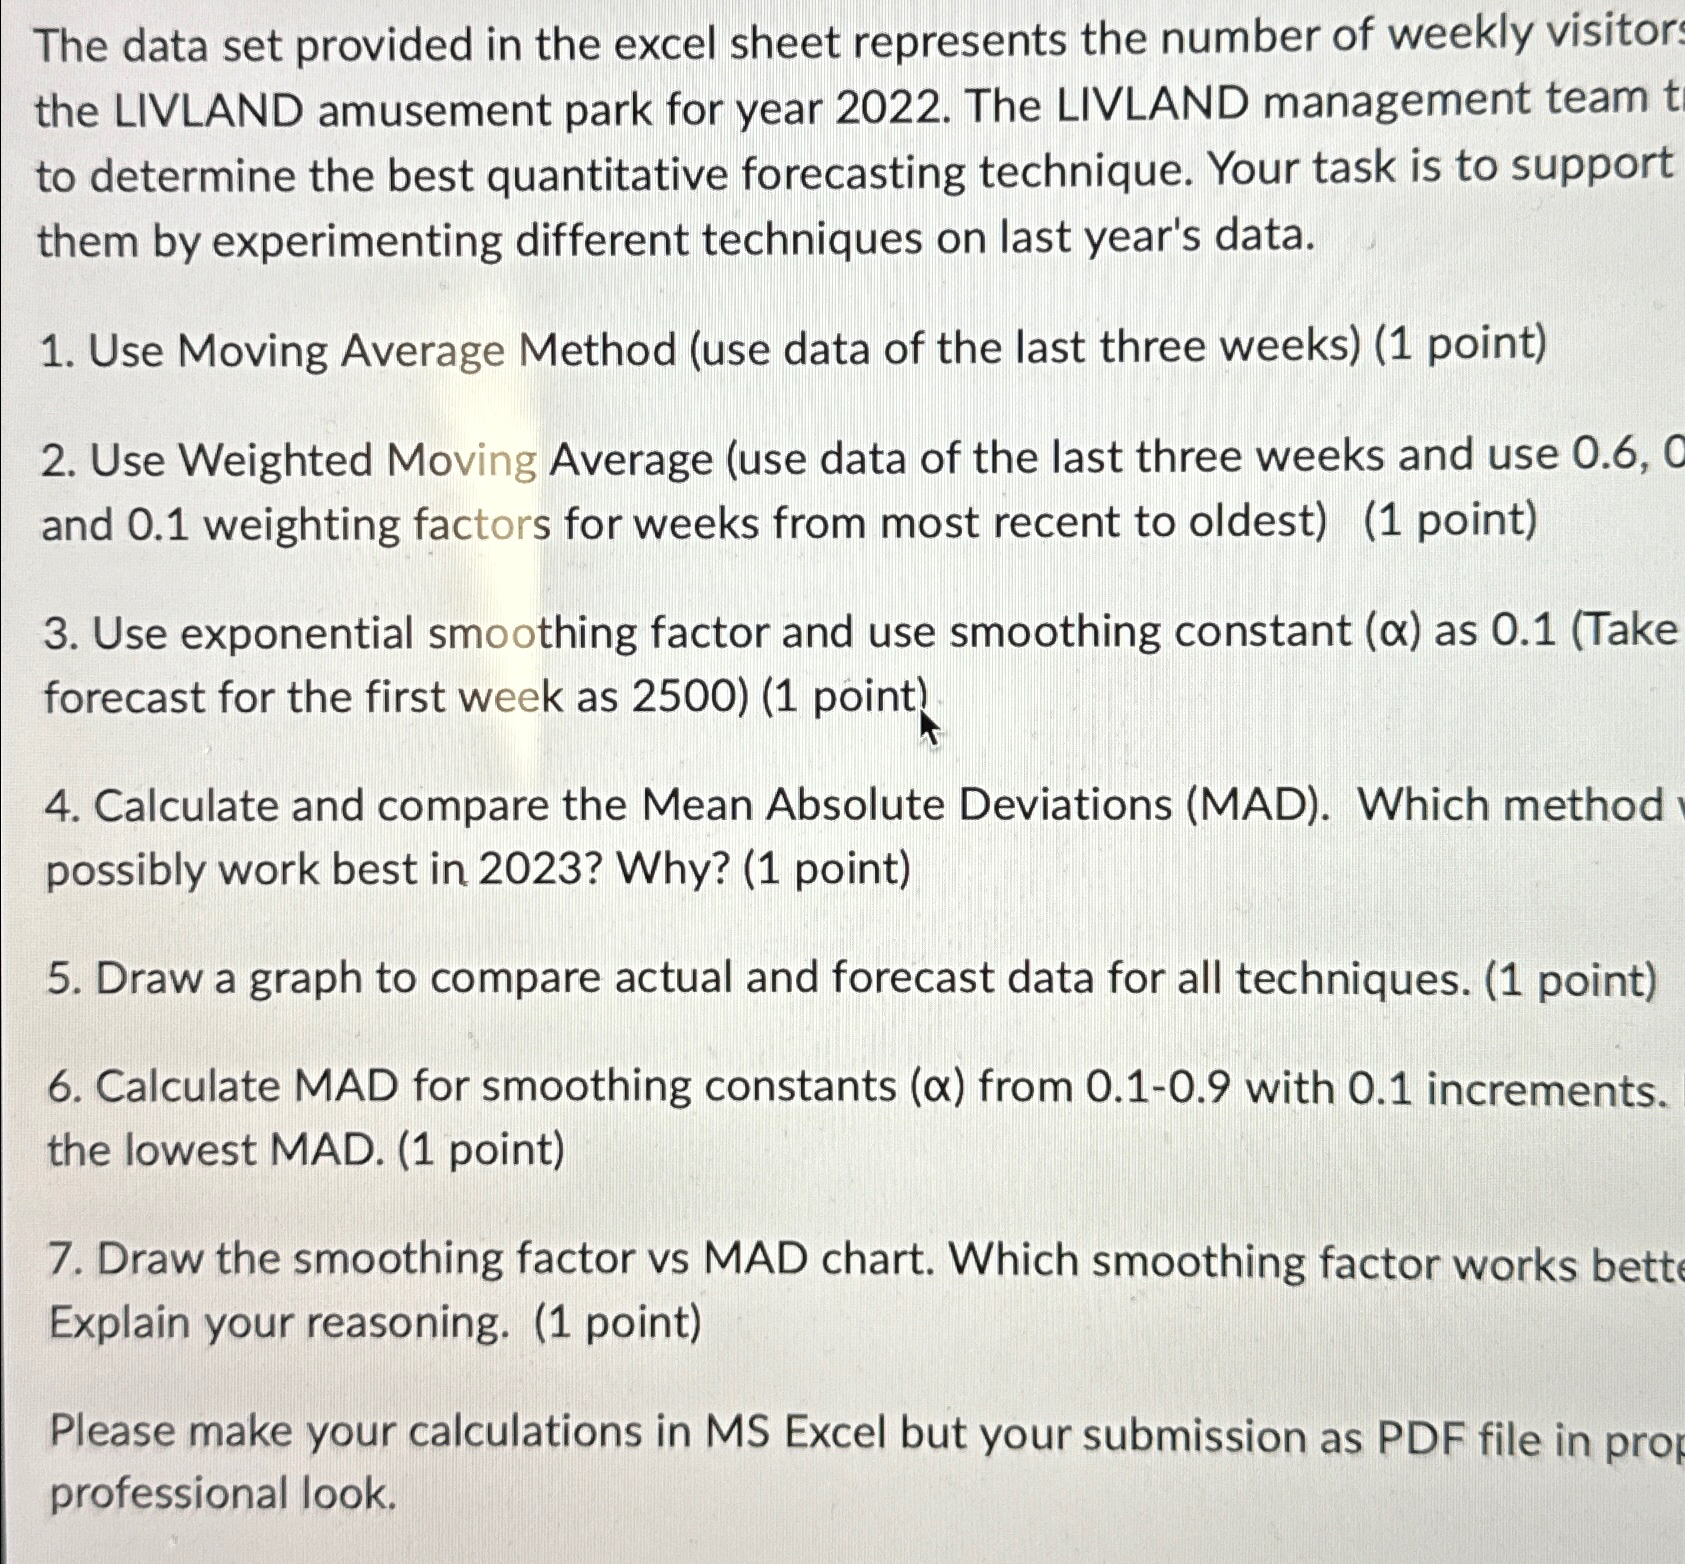
The data set provided in the excel sheet represents the number of weekly visitor the LIVLAND amusement park for year The LIVLAND management team to determine the best quantitative forecasting technique. Your task is to support them by experimenting different techniques on last year's data.
Use Moving Average Method use data of the last three weeks point
Use Weighted Moving Average use data of the last three weeks and use and weighting factors for weeks from most recent to oldest point
Use exponential smoothing factor and use smoothing constant as Take forecast for the first week as point
Calculate and compare the Mean Absolute Deviations MAD Which method possibly work best in Why? point
Draw a graph to compare actual and forecast data for all techniques. point
Calculate MAD for smoothing constants from with increments. the lowest MAD. point
Draw the smoothing factor vs MAD chart. Which smoothing factor works bett Explain your reasoning. point
Please make your calculations in MS Excel but your submission as PDF file in prop professional look.
Step by Step Solution
There are 3 Steps involved in it
1 Expert Approved Answer
Step: 1 Unlock

Question Has Been Solved by an Expert!
Get step-by-step solutions from verified subject matter experts
Step: 2 Unlock
Step: 3 Unlock