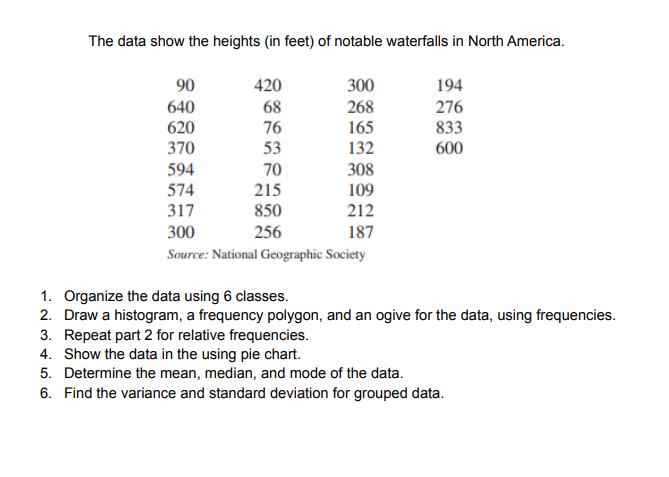
The data show the heights (in feet) of notable waterfalls in North America. 194 276 833...
Fantastic news! We've Found the answer you've been seeking!
Question:
Transcribed Image Text:
The data show the heights (in feet) of notable waterfalls in North America. 194 276 833 600 90 640 620 370 594 574 317 300 Source: National Geographic Society 420 68 76 53 70 215 850 256 300 268 165 132 308 109 212 187 1. Organize the data using 6 classes. 2. Draw a histogram, a frequency polygon, and an ogive for the data, using frequencies. 3. Repeat part 2 for relative frequencies. 4. Show the data in the using pie chart. 5. Determine the mean, median, and mode of the data. 6. Find the variance and standard deviation for grouped data. The data show the heights (in feet) of notable waterfalls in North America. 194 276 833 600 90 640 620 370 594 574 317 300 Source: National Geographic Society 420 68 76 53 70 215 850 256 300 268 165 132 308 109 212 187 1. Organize the data using 6 classes. 2. Draw a histogram, a frequency polygon, and an ogive for the data, using frequencies. 3. Repeat part 2 for relative frequencies. 4. Show the data in the using pie chart. 5. Determine the mean, median, and mode of the data. 6. Find the variance and standard deviation for grouped data.
Expert Answer:
Answer rating: 100% (QA)
To organize the data into six classes we need to determine the class intervals and count the frequency of data falling within each interval Lets start by organizing the data into classes 1 Organizing ... View the full answer
Related Book For
Elementary Statistics A Step By Step Approach
ISBN: 978-1259755330
10th edition
Authors: Allan G. Bluman
Posted Date:
Students also viewed these mathematics questions
-
The data show the heights in feet of 14 roller coasters. Find the mean, median, midrange, and mode for the data. 102 105 125 50 91 95 102 120 160 95 118 160 50 84
-
The data show the heights (in feet) of notable waterfalls in North America. Organize the data into a grouped frequency distribution using 6 classes. This data will be used for Exercises 7, 9, and 11....
-
Find the variance and standard deviation for the two distributions in Exercises 8 and 18 in Section 22. Compare the variation of the data sets. Decide if one data set is more variable than the other....
-
Write a program HowMany that takes a variable number of command-line arguments and prints how many there are.
-
Compare and contrast the two basic procurement strategies of corporate procurement and project procurement.
-
A steel rod \(20 \mathrm{~mm}\) diameter is passed through a brass tube \(25 \mathrm{~mm}\) internal diameter and \(30 \mathrm{~mm}\) external diameter. The tube is \(1 \mathrm{~m}\) long and is...
-
Analyze the ways in which Europeans attempted to extract wealth from their colonies in the 19th and 20th centuries.
-
The stockholders equity accounts of Ashley Corporation on January 1, 2012, were as follows. Preferred Stock (8%, $50 par, cumulative, 10,000 shares authorized)..... $ 400,000 Common Stock ($1 stated...
-
(9%) Problem 5: A ball is punted from the ground at an angle of 0 = 56 degrees with respect to the horizontal. The ball is in the air for a time tm = 1.1 s before it lands back on the ground....
-
Under Armour, Inc. is an American supplier of sportswear and casual apparel. Following are selected financial data for the company for the period 20092013. a. Calculate Under Armours annual...
-
A firm maintains a debt-to-equity ratio of 0.65 and has a tax rate of 41%. The company does not issue preferred stock but has a pre-tax cost of debt of 10.00%. There are 20,000 shares of the...
-
1 . A 3 0 - year 6 . 5 0 0 % semi - annual coupon bond has a tenor of 1 7 years and a yield to maturity of 7 . 7 5 0 % . In percent of PAR, what is the price of the bond today? 2 . A 3 0 - year 5 . 5...
-
Assume you are employed as the chief financial officer of a corporation and are responsible for the preparation of the financial statements, including the adjusting process and preparation of the...
-
Vulcan Supplements makes fuel additives for use in motor racing and uses a standard costing system to monitor both sales and production costs to evaluate performance. The budgeted sales data for the...
-
Joseph Martin, age 66, is the owner of Pediatric Surgical, an S corporation. The company manufactures surgical implements for pediatric surgery. He founded the company 30 years ago after working as a...
-
Suppose that the demand for a product is Q = 100 - 4P and supply is Q = -20 + 2P where P is price. The external damage or cost (EC) caused by the good is $8 per unit. Plot a graph showing the demand...
-
Should the US use fiscal policy to encourage long run growth of the economy?
-
Simplify the expression. Assume that all variables are positive. 23VI1 2 V44 8
-
The mean time it takes a group of students to complete a statistics final exam is 44 minutes, and the standard deviation is 9 minutes. Within what limits would you expect approximately 95% of the...
-
If 3 digits are selected at random with replacement, find the probability of getting at least one odd number. Would you consider this event likely or unlikely? Why?
-
Smart TVs have seen success in the United States market. During the 2nd quarter of 2015 45% of TVs sold in the United States were Smart TVs. Thats an increase of 11% from 2014. Choose three...
-
Using the online code for the example in this chapter as a starting point and the solution from a previous exercise. 1. Implement (or modify your previous) Student: :DropCourse (). When a student...
-
What other examples can you imagine that might easily incorporate the Factory Method pattern?
-
Using the solution from a previous exercise, augment your code as follows: 1. Implement the Factory Method pattern to create various shapes. You will have already created an abstract base class of...
Study smarter with the SolutionInn App