

Question: The data shown below is collected from a sample 74 75 78 70 71 71 74 75 72 73 69 77 68 69 75 73

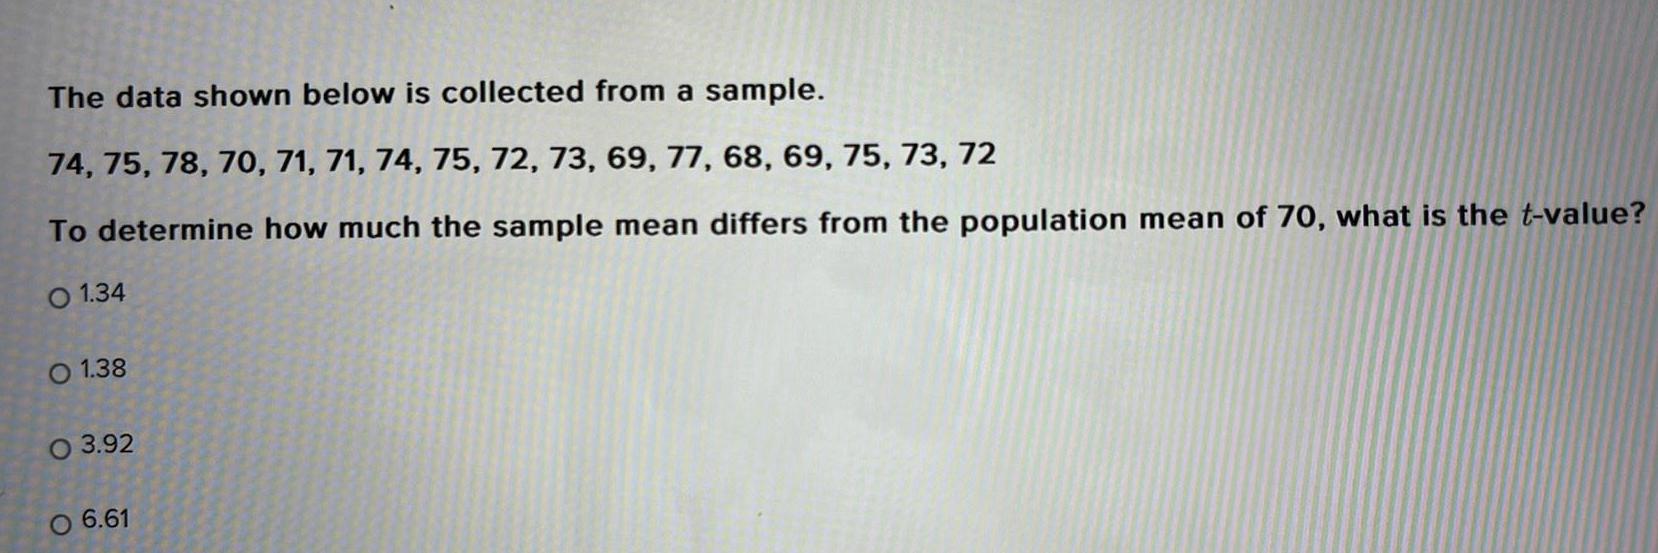
The data shown below is collected from a sample 74 75 78 70 71 71 74 75 72 73 69 77 68 69 75 73 72 To determine how much the sample mean differs from the population mean of 70 what is the t value O 1 34 O 1 38 O 3 92 6 61
Step by Step Solution
There are 3 Steps involved in it
1 Expert Approved Answer
Step: 1 Unlock

Question Has Been Solved by an Expert!
Get step-by-step solutions from verified subject matter experts
Step: 2 Unlock
Step: 3 Unlock