

Question: The data shown below represent the repair oost for a low-impact collision in a simple random sample of mini- and micro-vehicles. Complete parts (a) through
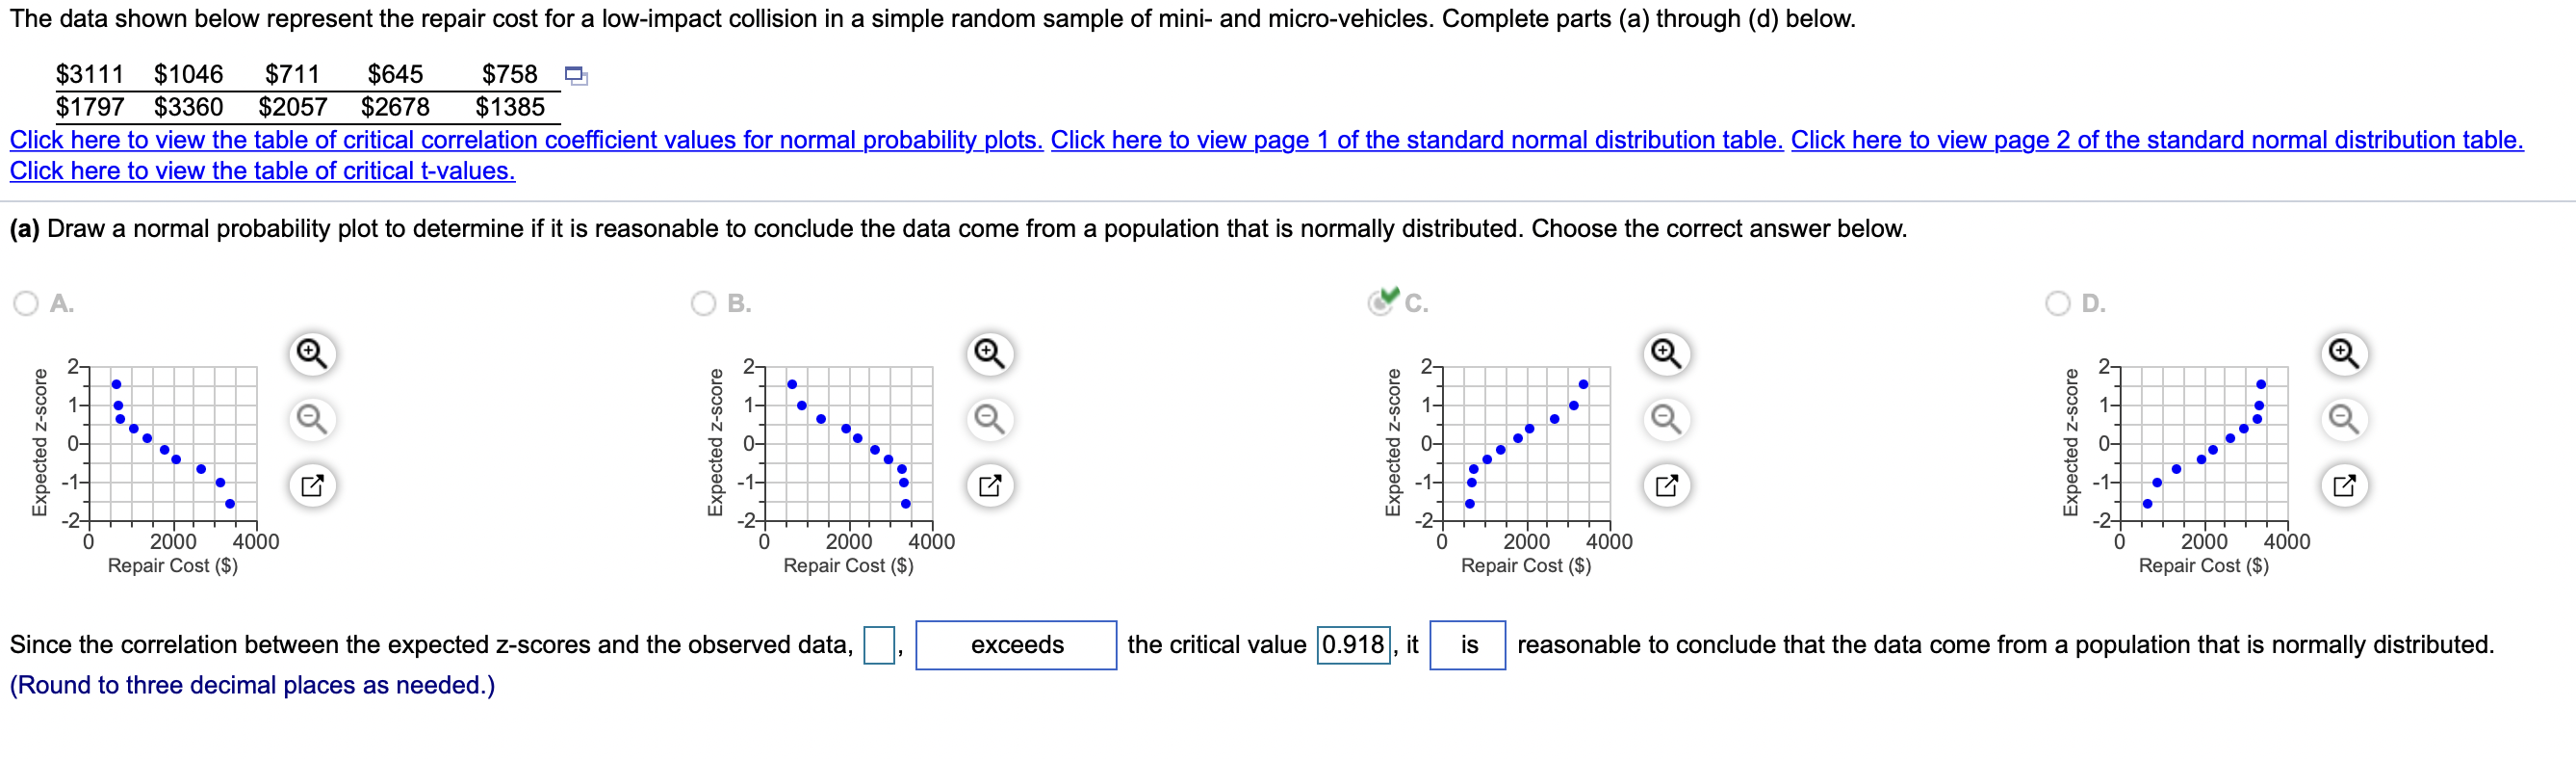
The data shown below represent the repair oost for a low-impact collision in a simple random sample of mini- and micro-vehicles. Complete parts (a) through (d) below. $3111 $1046 $711 $645 $758 la $1797 $3360 $2057 $2678 $1385 Click here to view the table of critical correlation coefcient values for normal probabiliy_plots. Click here to view p_age 1 of the standard normal distribution table. Click here to view p_age 2 of the standard normal distribution table. Click here to view the table of critical tvalues. (a) Draw a normal probability plot to determine if it is reasonable to conclude the data come from a population that is normally distributed. Choose the correct answer below. A. B. No D. g Q g Q g 27 Q, g m m m 1- m in Q it Q it ' Q in 3 7 8 7 8 my r , 8 ' a. 3; . ' a. 3; -1 . 1 i m 3; a p 2% 7+ p 2 7 a p - ,...,...r - ,........ ,......r 0 2000 4000 0 2000 4000 0 2000 4000 0 2000 4000 Repair Cost (3) Repair Cost (5) Repair Cost (3) Repair Cost (3) Since the correlation between the expected z-scores and the observed data, , exceeds the critical value 0.918 , it is reasonable to conclude that the data come from a population that is normally distributed. (Round to three decimal places as needed)
Step by Step Solution
There are 3 Steps involved in it

Get step-by-step solutions from verified subject matter experts