

Question: the data shown in the following table: . a . Calculate the betas for portfolios A and B . b . Compare the risks of
the data shown in the following table:
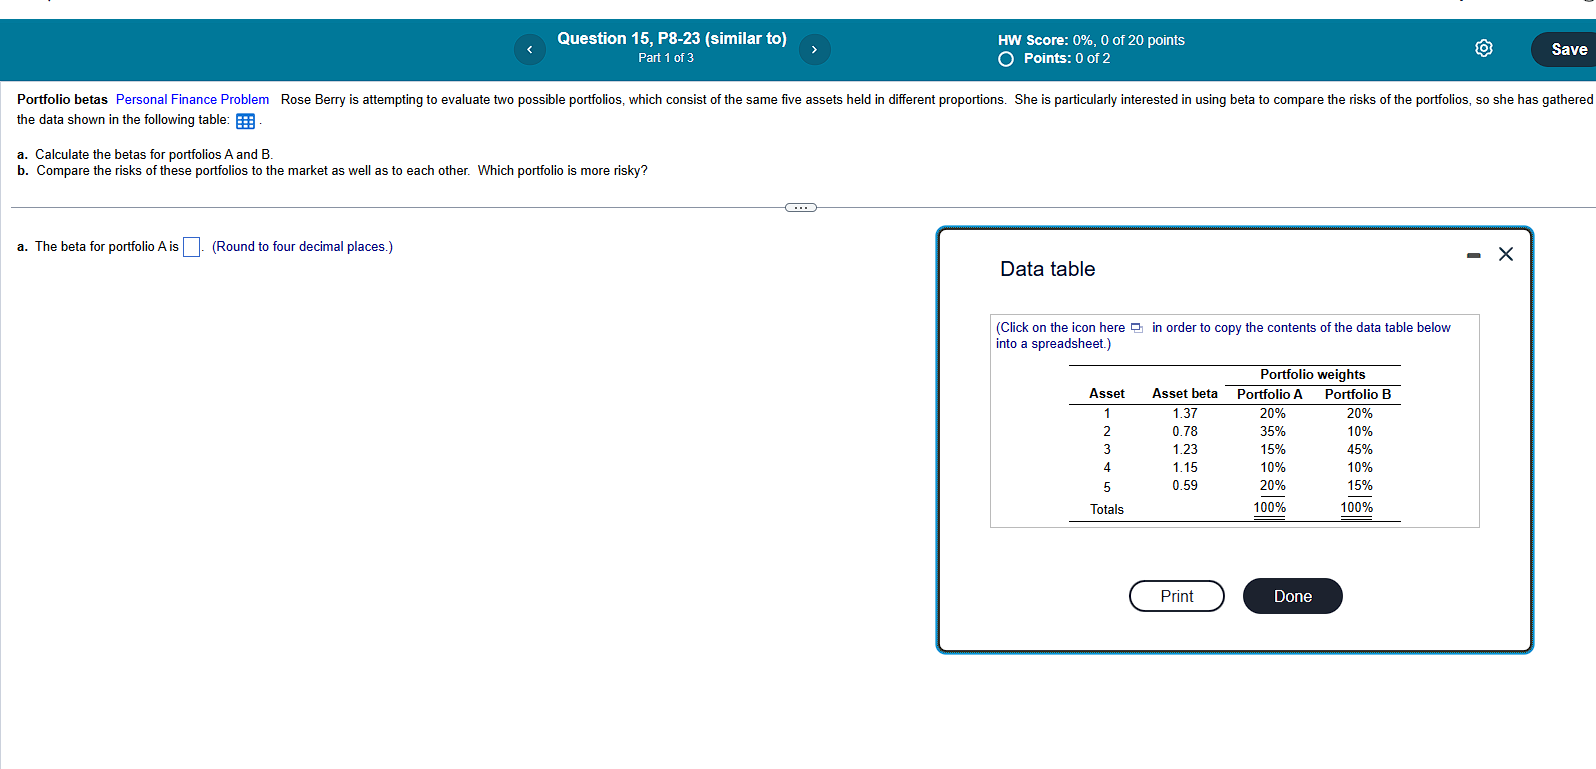
a Calculate the betas for portfolios A and B
b Compare the risks of these portfolios to the market as well as to each other. Which portfolio is more risky?
a The beta for portfolio A is
Round to four decimal places.
Data table
Click on the icon here in order to copy the contents of the data tablew
into a spreadsheet.
Step by Step Solution
There are 3 Steps involved in it
1 Expert Approved Answer
Step: 1 Unlock

Question Has Been Solved by an Expert!
Get step-by-step solutions from verified subject matter experts
Step: 2 Unlock
Step: 3 Unlock