

Question: The data shown in the following table are sample corporate data on 10 U.S. public utility companies. We are interested in forming groups of similar
The data shown in the following table are sample corporate data on 10 U.S. public utility companies. We are interested in forming groups of similar utilities based on the given two features Sales and Fuel Cost. It would save a considerable amount of time and effort if we could cluster similar types of utilities and build detailed cost models for just one typical utility in each cluster and then scale up from these models to estimate results for all utilities.
Based on the data available,
- First show a scatterplot of companies with these two features, with labels marking each company. (This is done before you normalize the dataset)
- Please perform a k-means clustering on the given data with k = 3 and please show the steps of clustering with a corresponding scatterplot. The raw data should be normalized with Z-score normalization before clustering (mean and standard deviation are given, they are from a large dataset).
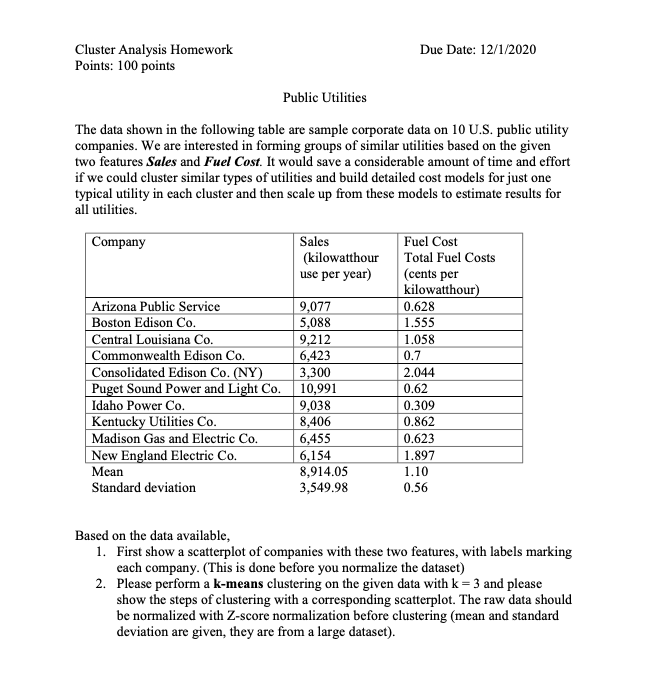
Cluster Analysis Homework Due Date: 12/1/2020 Points: 100 points Public Utilities The data shown in the following table are sample corporate data on 10 U.S. public utility companies. We are interested in forming groups of similar utilities based on the given two features Sales and Fuel Cost. It would save a considerable amount of time and effort if we could cluster similar types of utilities and build detailed cost models for just one typical utility in each cluster and then scale up from these models to estimate results for all utilities. Company Sales Fuel Cost (kilowatthour Total Fuel Costs use per year) (cents per kilowatthour) Arizona Public Service 9,077 0.628 Boston Edison Co. 5,088 1.555 Central Louisiana Co. 9,212 1.058 Commonwealth Edison Co. 6,423 0.7 Consolidated Edison Co. (NY) 3,300 2.044 Puget Sound Power and Light Co. 10,991 0.6 Idaho Power Co. 9.038 0.309 Kentucky Utilities Co. 8,406 0.862 Madison Gas and Electric Co. 6,455 0.623 New England Electric Co 6,154 1.897 Mean 8,914.05 1.10 Standard deviation 3,549.98 0.56 Based on the data available, 1. First show a scatterplot of companies with these two features, with labels marking each company. (This is done before you normalize the dataset) 2. Please perform a k-means clustering on the given data with k = 3 and please show the steps of clustering with a corresponding scatterplot. The raw data should be normalized with Z-score normalization before clustering (mean and standard deviation are given, they are from a large dataset)
Step by Step Solution
There are 3 Steps involved in it

Get step-by-step solutions from verified subject matter experts