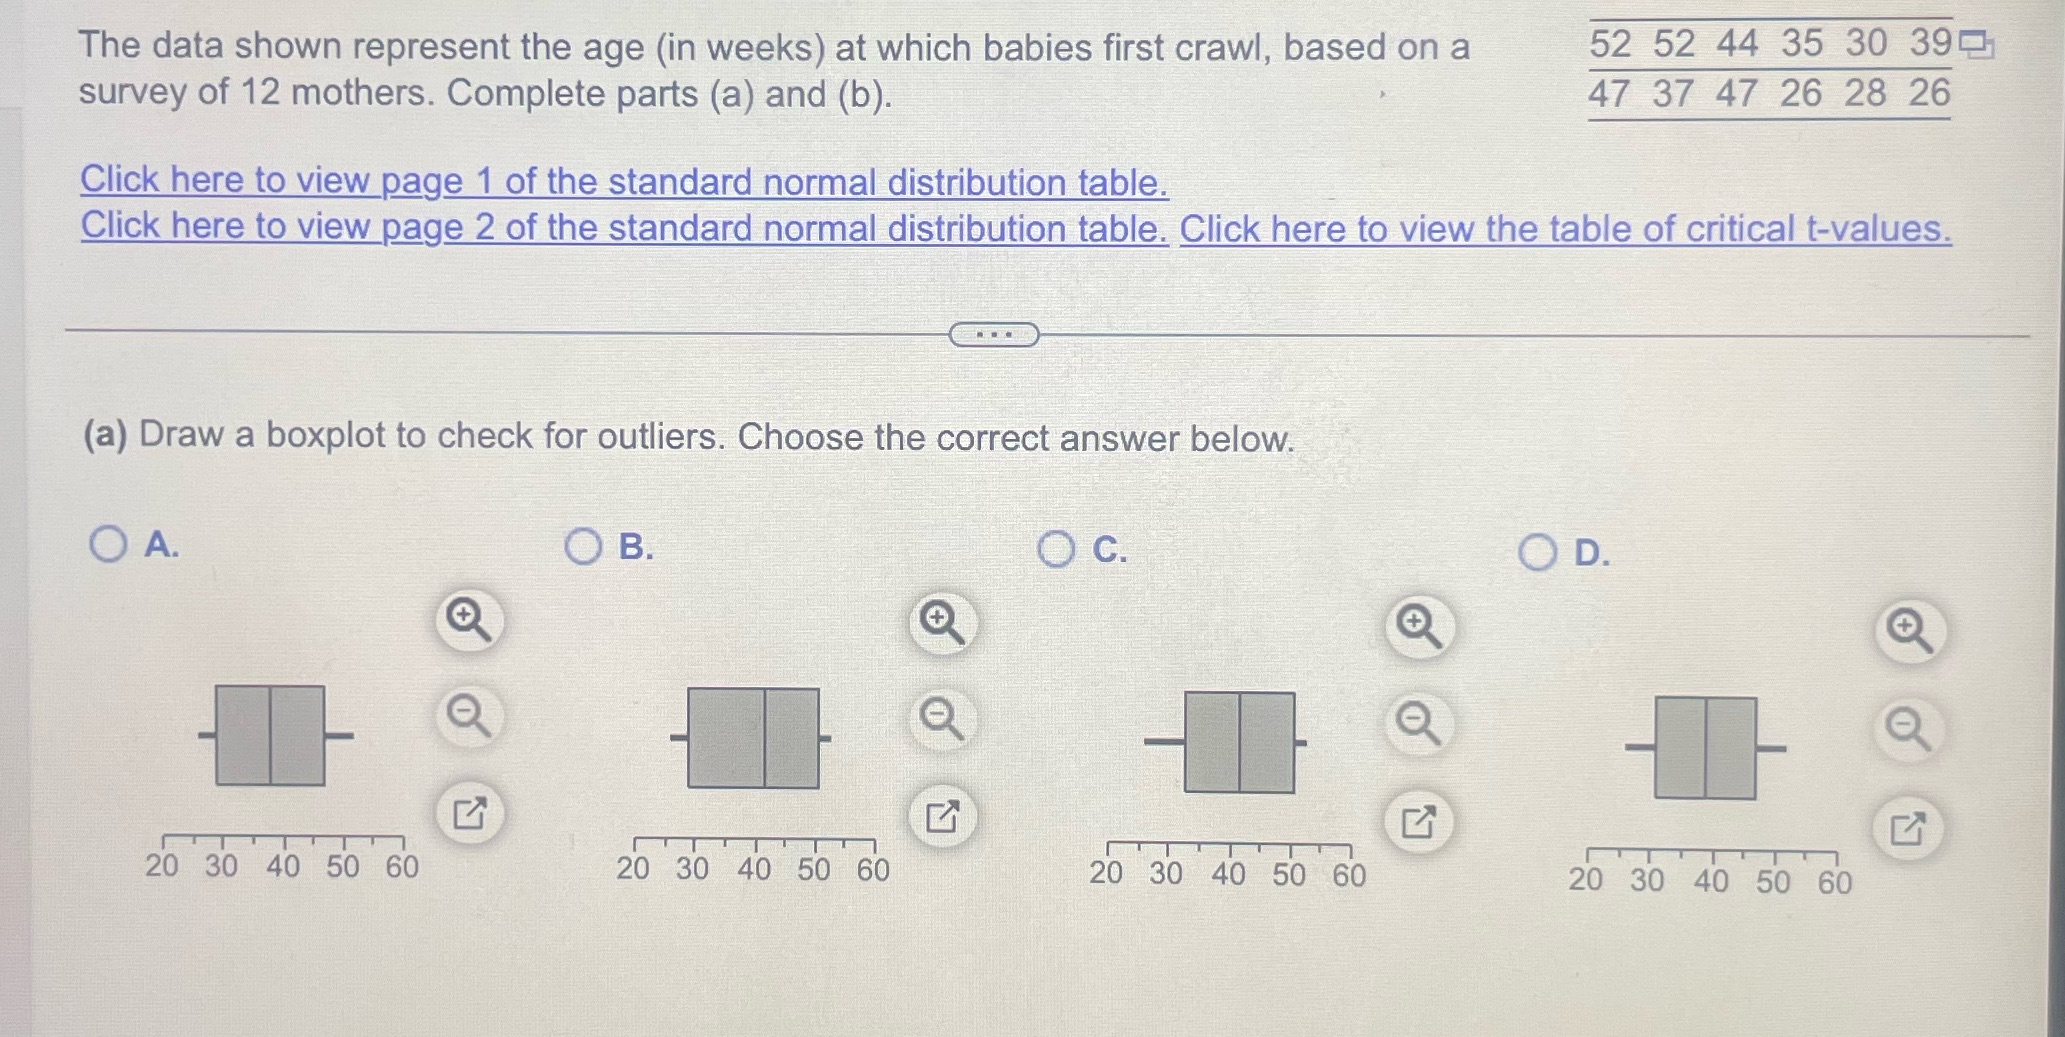
Question: The data shown represent the age (in weeks) at which babies first crawl, based on a 52 52 44 35 30 39 survey of 12

The data shown represent the age (in weeks) at
The data shown represent the age (in weeks) at which babies first crawl, based on a 52 52 44 35 30 39 survey of 12 mothers. Complete parts (a) and (b). 47 37 47 26 28 26 Click here to view page 1 of the standard normal distribution table. Click here to view page 2 of the standard normal distribution table. Click here to view the table of critical t-values. (a) Draw a boxplot to check for outliers. Choose the correct answer below. O A. O B. O C. O D. + + 20 30 40 50 60 20 30 40 50 60 20 30 40 50 60 20 30 40 50 60

Step by Step Solution

There are 3 Steps involved in it

1 Expert Approved Answer
Step: 1 Unlock blur-text-image
Question Has Been Solved by an Expert!

Get step-by-step solutions from verified subject matter experts

Step: 2 Unlock
Step: 3 Unlock

Students Have Also Explored These Related Mathematics Questions!