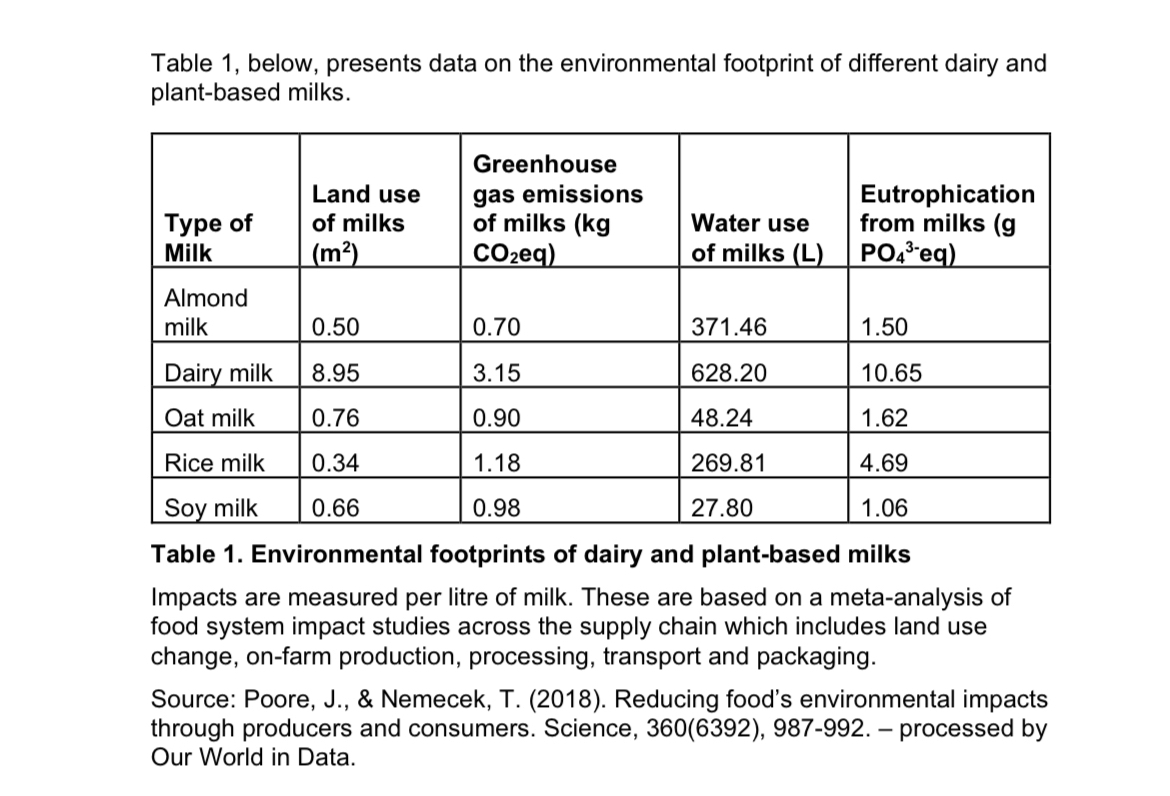
Question: The data summarised in Table 1 takes into account environmental impacts of the transport and packaging of the different milks. Briefly summarise why it is

The data summarised in Table 1 takes into account environmental impacts of the transport and packaging of the different milks. Briefly summarise why it is important to pay attention to these aspects of the food supply chain when assessing the environmental effects of food.

The data summarised in Table 1 takes into account
Table 1, below, presents data on the environmental footprint of different dairy and plant-based milks. Greenhouse Land use gas emissions Eutrophication Type of of milks of milks (kg Water use from milks (g Milk (m?) COzeq) of milks (L) PO43-eq) Almond milk 0.50 0.70 371.46 1.50 Dairy milk 8.95 3. 15 628.20 10.65 Oat milk 0.76 0.90 48.24 1.62 Rice milk 0.34 1.18 269.81 4.69 Soy milk 0.66 0.98 27.80 1.06 Table 1. Environmental footprints of dairy and plant-based milks Impacts are measured per litre of milk. These are based on a meta-analysis of food system impact studies across the supply chain which includes land use change, on-farm production, processing, transport and packaging. Source: Poore, J., & Nemecek, T. (2018). Reducing food's environmental impacts through producers and consumers. Science, 360(6392), 987-992. - processed by Our World in Data

Step by Step Solution

There are 3 Steps involved in it

1 Expert Approved Answer
Step: 1 Unlock blur-text-image
Question Has Been Solved by an Expert!

Get step-by-step solutions from verified subject matter experts

Step: 2 Unlock
Step: 3 Unlock

Students Have Also Explored These Related Accounting Questions!