

Question: The data table shows the yields for a one-year certificate of deposit (CD) and a five-year CD for 13 banks. Complete parts (a) through (c).
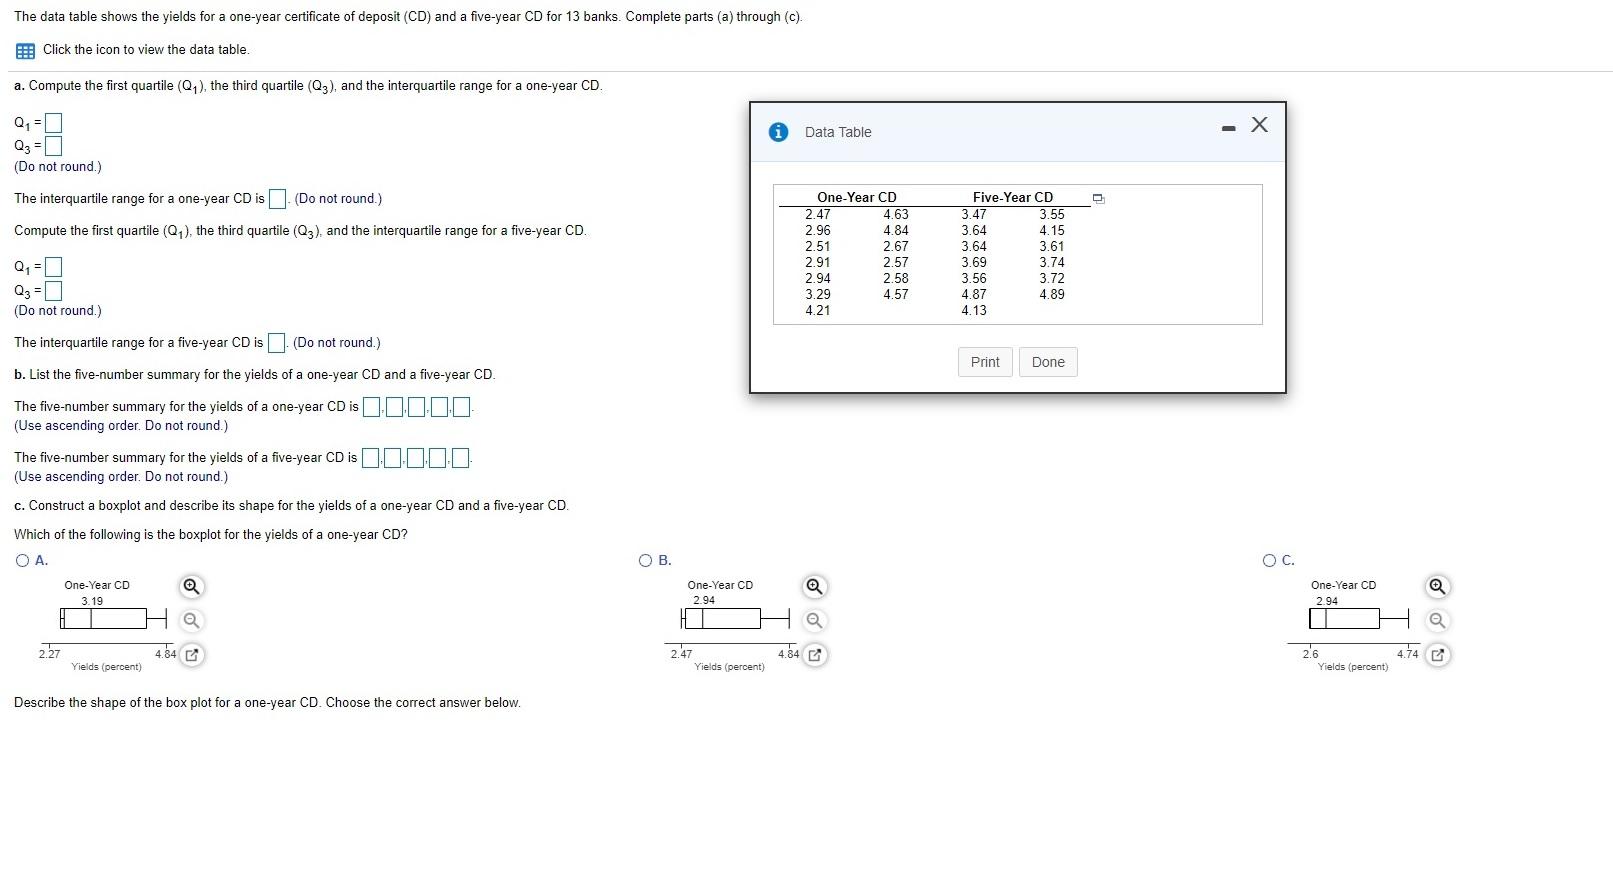
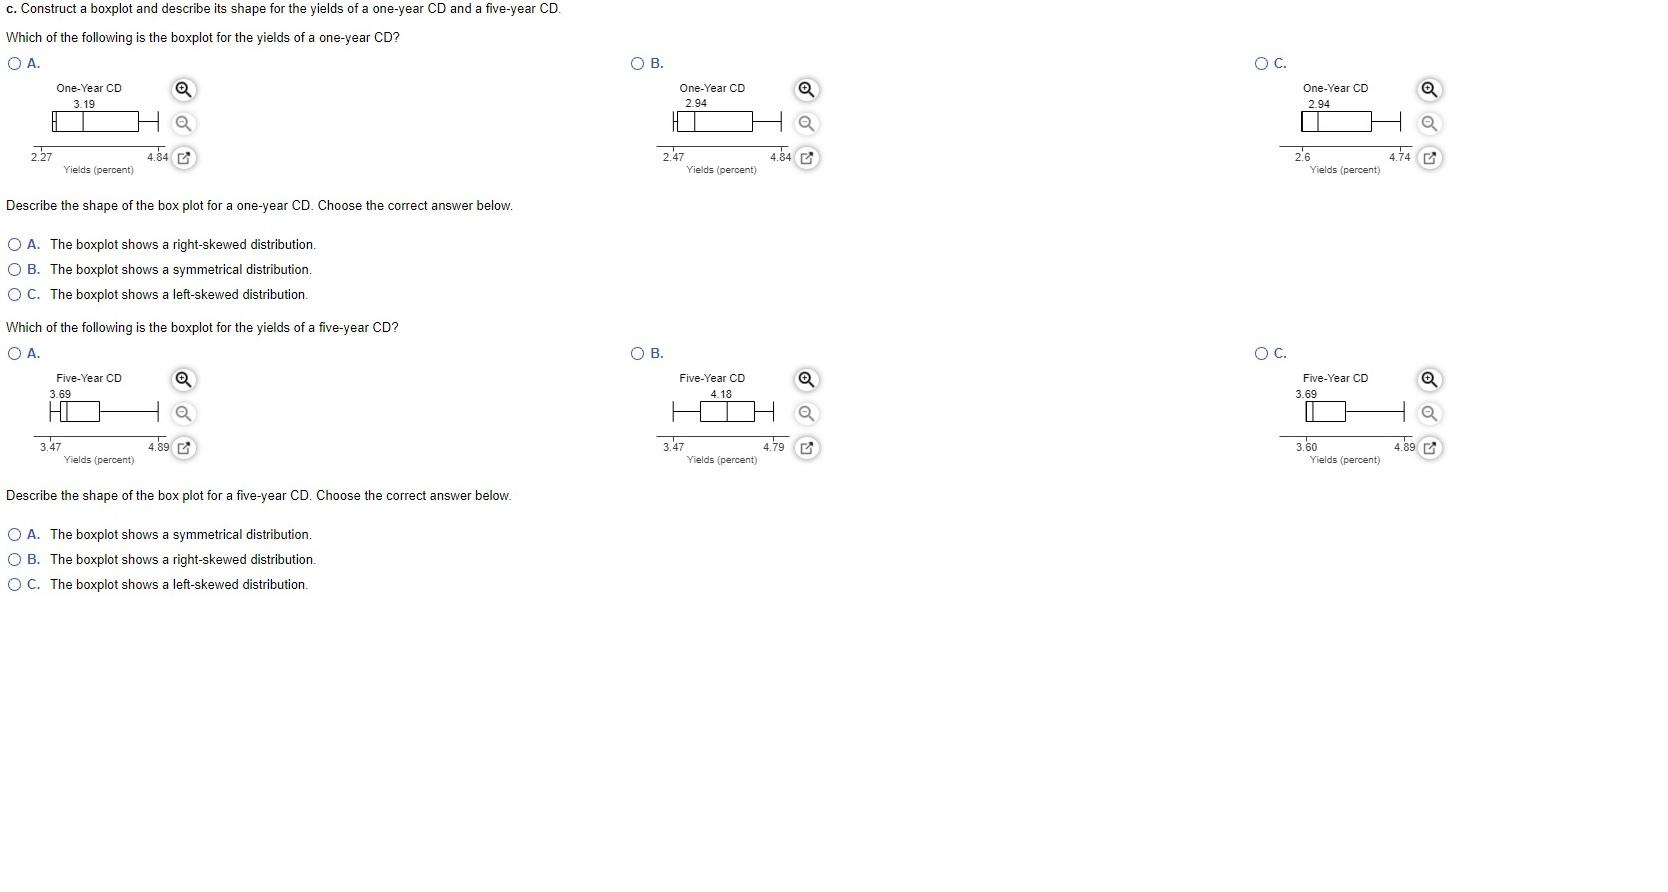
The data table shows the yields for a one-year certificate of deposit (CD) and a five-year CD for 13 banks. Complete parts (a) through (c). Click the icon to view the data table a. Compute the first quartile (Q1), the third quartile (Q3), and the interquartile range for a one-year CD. - X Data Table Q3 = (Do not round.) The interquartile range for a one-year CD is (Do not round.) Compute the first quartile (Q), the third quartile (Q3), and the interquartile range for a five-year CD. One-Year CD 2.47 4.63 2.96 4.84 2.51 2.67 2.91 2.57 2.94 2.58 3.29 4.57 4.21 Five-Year CD 3.47 3.55 3.64 4.15 3.64 3.61 3.69 3.74 3.56 3.72 4.87 4.89 4.13 (Do not round.) The interquartile range for a five-year CD is (Do not round.) Print Done b. List the five-number summary for the yields of a one-year CD and a five-year CD. The five-number summary for the yields of a one-year CD is (Use ascending order. Do not round.) The five-number summary for the yields of a five-year CD is 10.000 (Use ascending order. Do not round.) c. Construct a boxplot and describe its shape for the yields of a one-year CD and a five-year CD. Which of the following is the boxplot for the yields of a one-year CD? OA. OB. OC. One-Year CD 3.19 One-Year CD 294 One-Year CD 2.94 2.27 4.84 G 2.47 Yields (percent) 26 4+4 Yields (percent) Yields (percent) Describe the shape of the box plot for a one-year CD. Choose the correct answer below. c. Construct a boxplot and describe its shape for the yields of a one-year CD and a five-year CD. Which of the following is the boxplot for the yields of a one-year CD? OA. OB. OC. One-Year CD 3.19 One-Year CD 2.94 One-Year CD 294 2.27 4.84 2.47 4.54 26 Yields (percent) 4.74 G Yields (percent) Yields (percent) Describe the shape of the box plot for a one-year CD. Choose the correct answer below. O A. The boxplot shows a right-skewed distribution. OB. The boxplot shows a symmetrical distribution. O C. The boxplot shows a left-skewed distribution. Which of the following is the boxplot for the yields of a five-year CD? OA. . OC. Five-Year CD 3.69 Five-Year CD 4.18 Five-Year CD 3.69 HQ 3.47 4.89 4.79 3.60 Yields (percent) 4.89 Yields (percent) Yields (percent) Describe the shape of the box plot for a five-year CD. Choose the correct answer below. O A. The boxplot shows a symmetrical distribution. OB. The boxplot shows a right-skewed distribution. O C. The boxplot shows a left-skewed distribution The data table shows the yields for a one-year certificate of deposit (CD) and a five-year CD for 13 banks. Complete parts (a) through (c). Click the icon to view the data table a. Compute the first quartile (Q1), the third quartile (Q3), and the interquartile range for a one-year CD. - X Data Table Q3 = (Do not round.) The interquartile range for a one-year CD is (Do not round.) Compute the first quartile (Q), the third quartile (Q3), and the interquartile range for a five-year CD. One-Year CD 2.47 4.63 2.96 4.84 2.51 2.67 2.91 2.57 2.94 2.58 3.29 4.57 4.21 Five-Year CD 3.47 3.55 3.64 4.15 3.64 3.61 3.69 3.74 3.56 3.72 4.87 4.89 4.13 (Do not round.) The interquartile range for a five-year CD is (Do not round.) Print Done b. List the five-number summary for the yields of a one-year CD and a five-year CD. The five-number summary for the yields of a one-year CD is (Use ascending order. Do not round.) The five-number summary for the yields of a five-year CD is 10.000 (Use ascending order. Do not round.) c. Construct a boxplot and describe its shape for the yields of a one-year CD and a five-year CD. Which of the following is the boxplot for the yields of a one-year CD? OA. OB. OC. One-Year CD 3.19 One-Year CD 294 One-Year CD 2.94 2.27 4.84 G 2.47 Yields (percent) 26 4+4 Yields (percent) Yields (percent) Describe the shape of the box plot for a one-year CD. Choose the correct answer below. c. Construct a boxplot and describe its shape for the yields of a one-year CD and a five-year CD. Which of the following is the boxplot for the yields of a one-year CD? OA. OB. OC. One-Year CD 3.19 One-Year CD 2.94 One-Year CD 294 2.27 4.84 2.47 4.54 26 Yields (percent) 4.74 G Yields (percent) Yields (percent) Describe the shape of the box plot for a one-year CD. Choose the correct answer below. O A. The boxplot shows a right-skewed distribution. OB. The boxplot shows a symmetrical distribution. O C. The boxplot shows a left-skewed distribution. Which of the following is the boxplot for the yields of a five-year CD? OA. . OC. Five-Year CD 3.69 Five-Year CD 4.18 Five-Year CD 3.69 HQ 3.47 4.89 4.79 3.60 Yields (percent) 4.89 Yields (percent) Yields (percent) Describe the shape of the box plot for a five-year CD. Choose the correct answer below. O A. The boxplot shows a symmetrical distribution. OB. The boxplot shows a right-skewed distribution. O C. The boxplot shows a left-skewed distribution
Step by Step Solution
There are 3 Steps involved in it

Get step-by-step solutions from verified subject matter experts