

Question: The data to the right show the average retirement ages for a random sample of workers in Country A and a random sample of workers
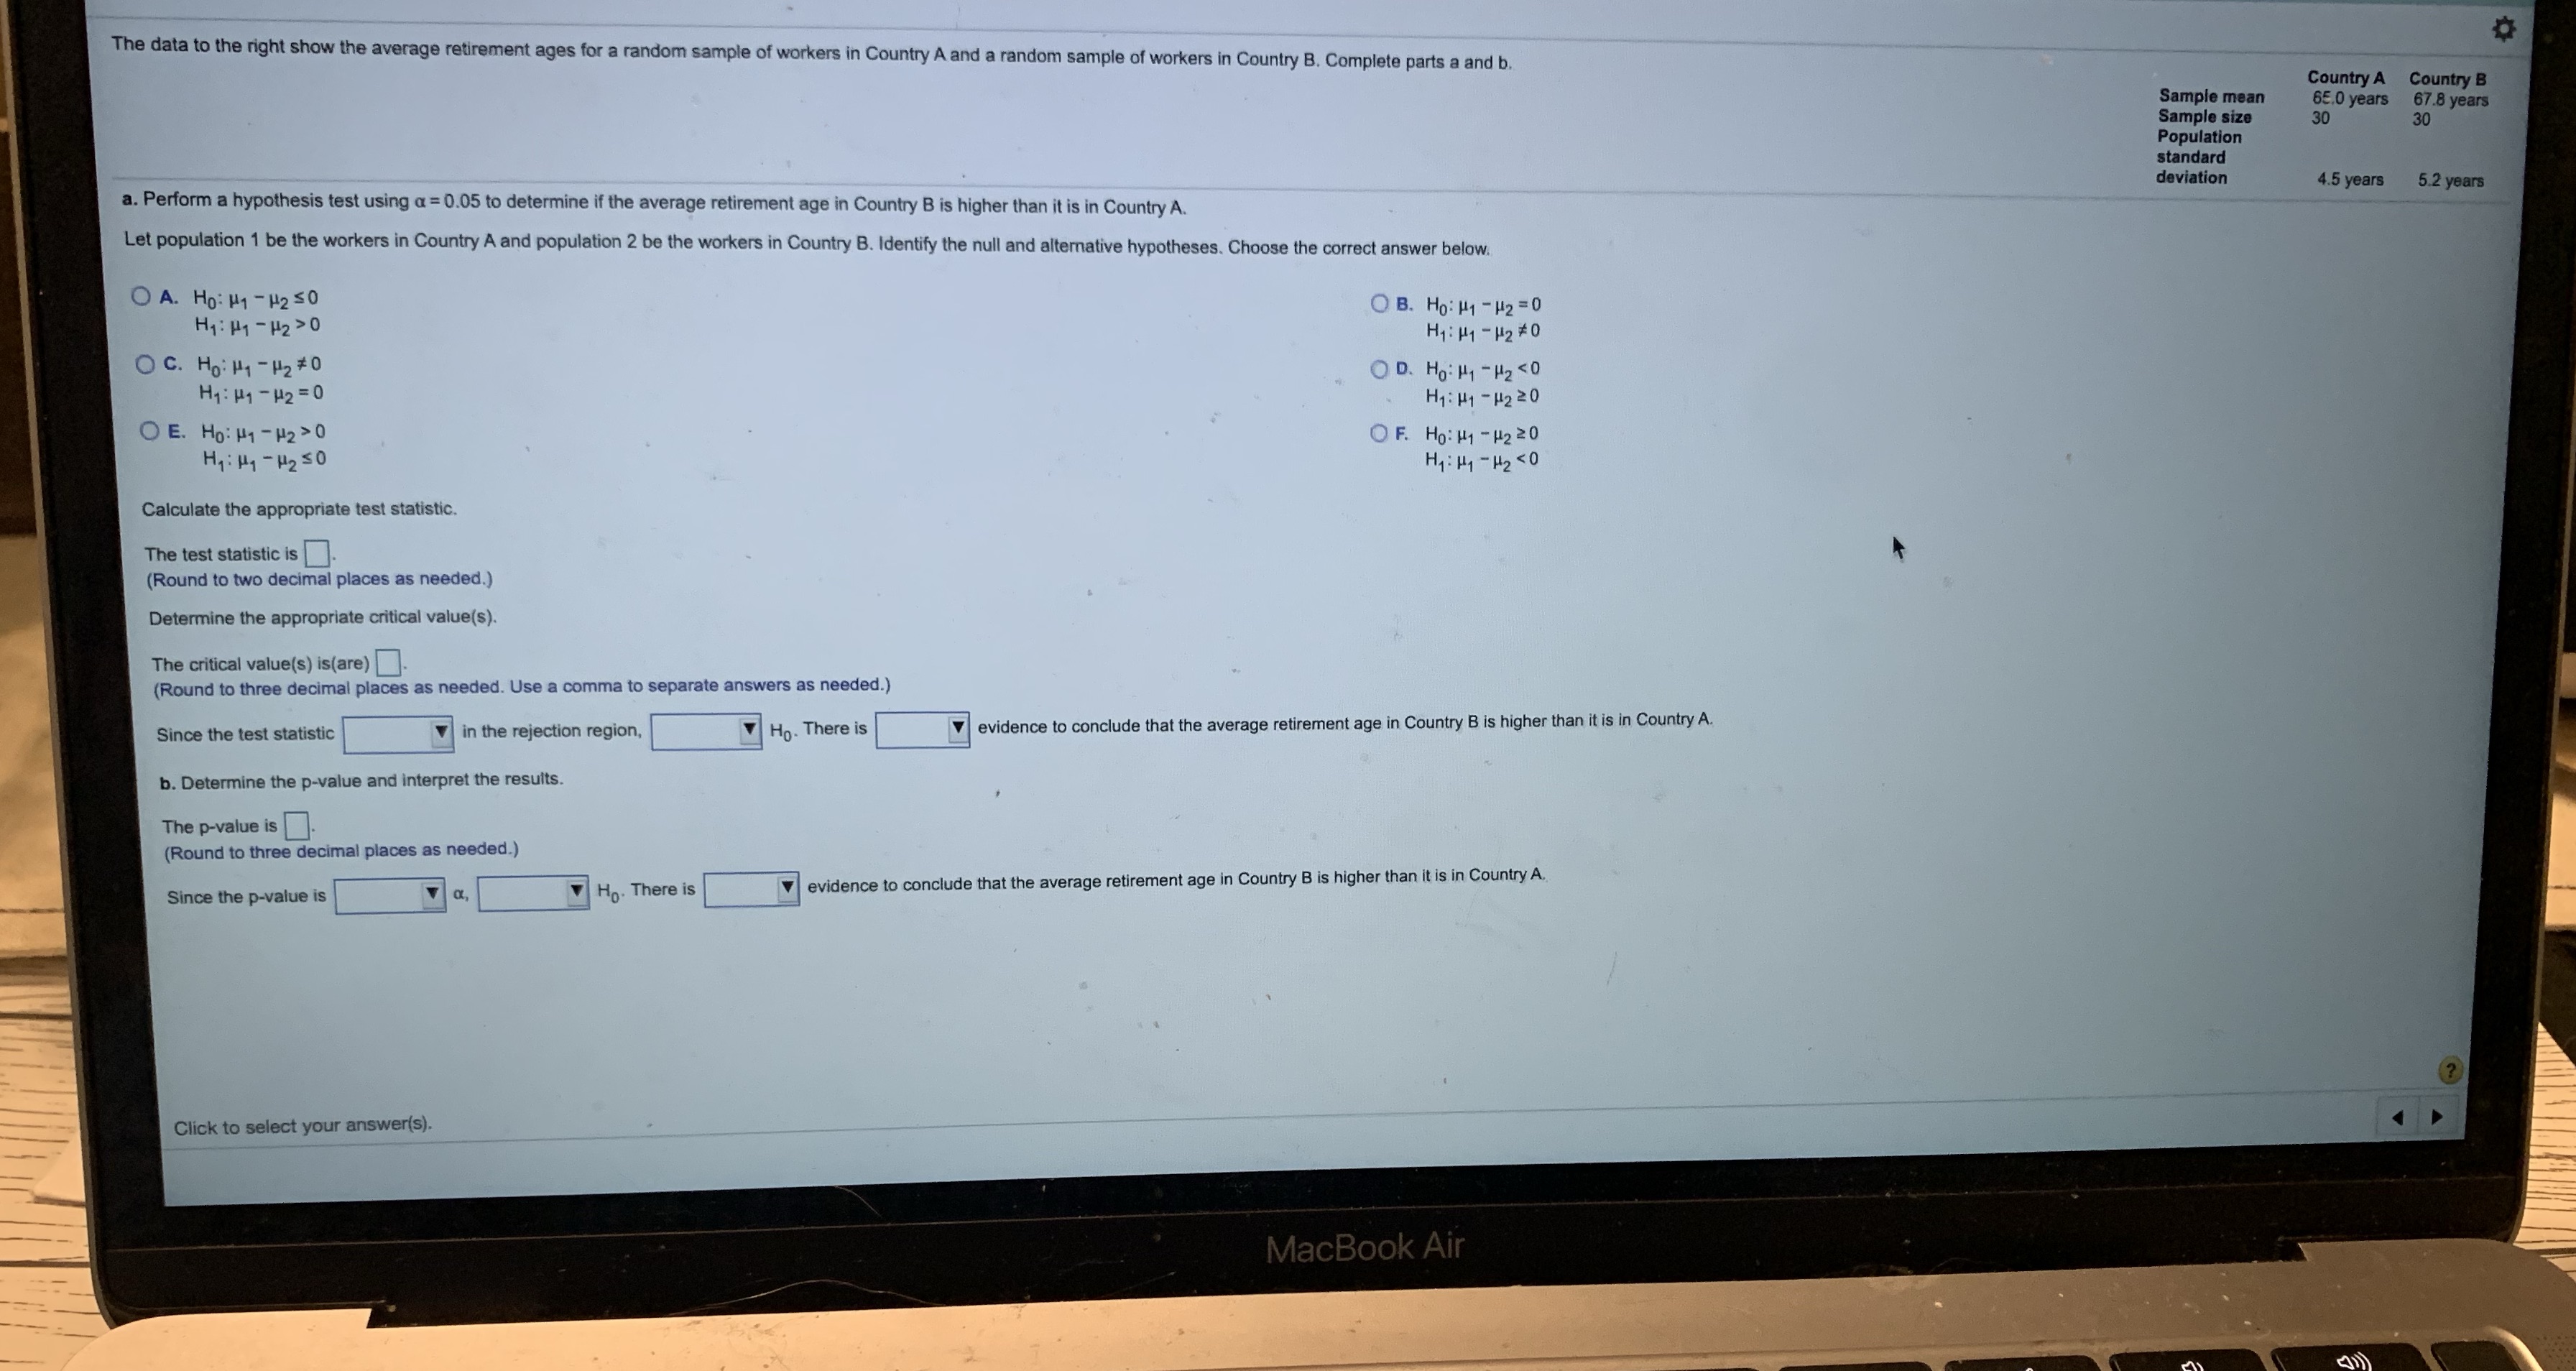
The data to the right show the average retirement ages for a random sample of workers in Country A and a random sample of workers in Country B. Complete parts a and b. Country A Country B Sample mean 65.0 years 67.8 years Sample size 30 30 Population standard deviation 4.5 years 5.2 years a. Perform a hypothesis test using a = 0.05 to determine if the average retirement age in Country B is higher than it is in Country A. Let population 1 be the workers in Country A and population 2 be the workers in Country B. Identify the null and alternative hypotheses. Choose the correct answer below. O A. HO: H1 - H2 0 OB. Ho: H1 - H2 =0 H1: 19 - H2>0 H1:19 - 12 * 0 O C. Ho: My - H2 # 0 OD. HO: H1 - H2 0 OF. HO: H1 - H2 20 Hy : Hq - H250 H1: H1 - H2 50 Calculate the appropriate test statistic. The test statistic is (Round to two decimal places as needed.) Determine the appropriate critical value(s). The critical value(s) is(are). Round to three decimal places as needed. Use a comma to separate answers as needed.) Since the test statistic in the rejection region, Ho. There is evidence to conclude that the average retirement age in Country B is higher than it is in Country A. b. Determine the p-value and interpret the results. The p-value is. (Round to three decimal places as needed.) Since the p-value is Va, Ho . There is evidence to conclude that the average retirement age in Country B is higher than it is in Country A. ? Click to select your answer(s) MacBook Air
Step by Step Solution
There are 3 Steps involved in it

Get step-by-step solutions from verified subject matter experts