

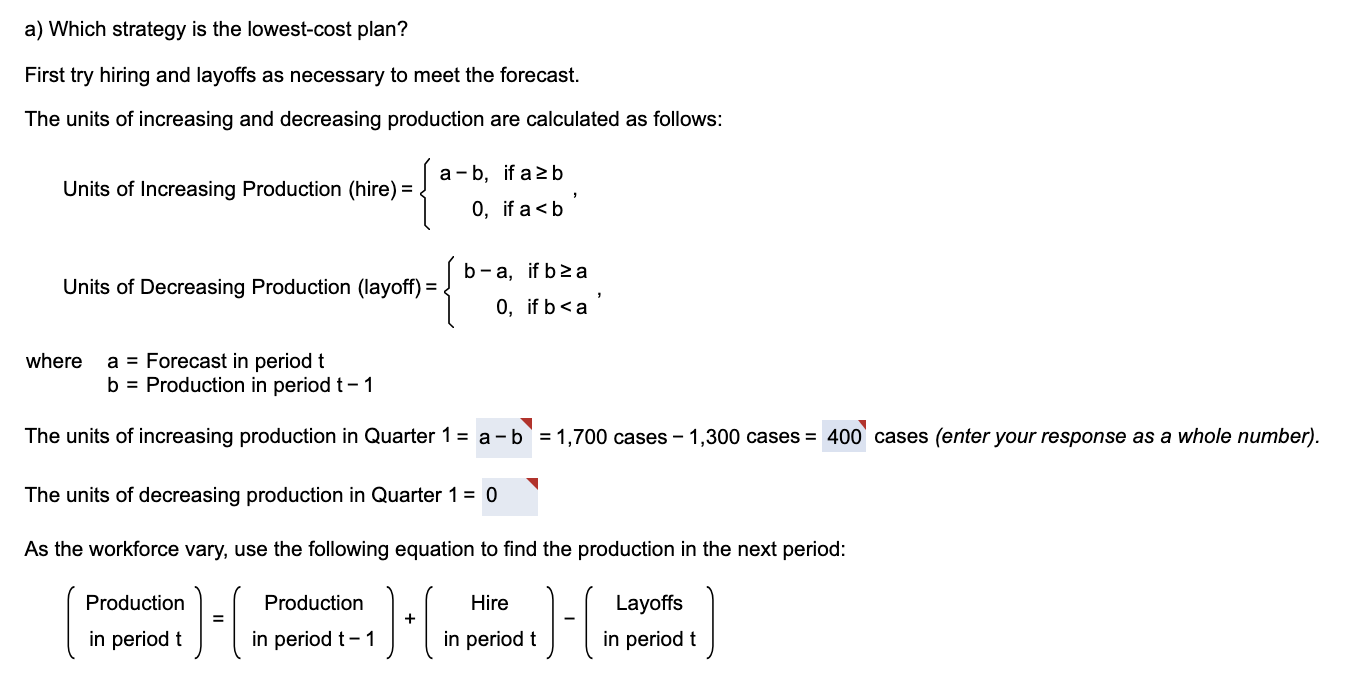
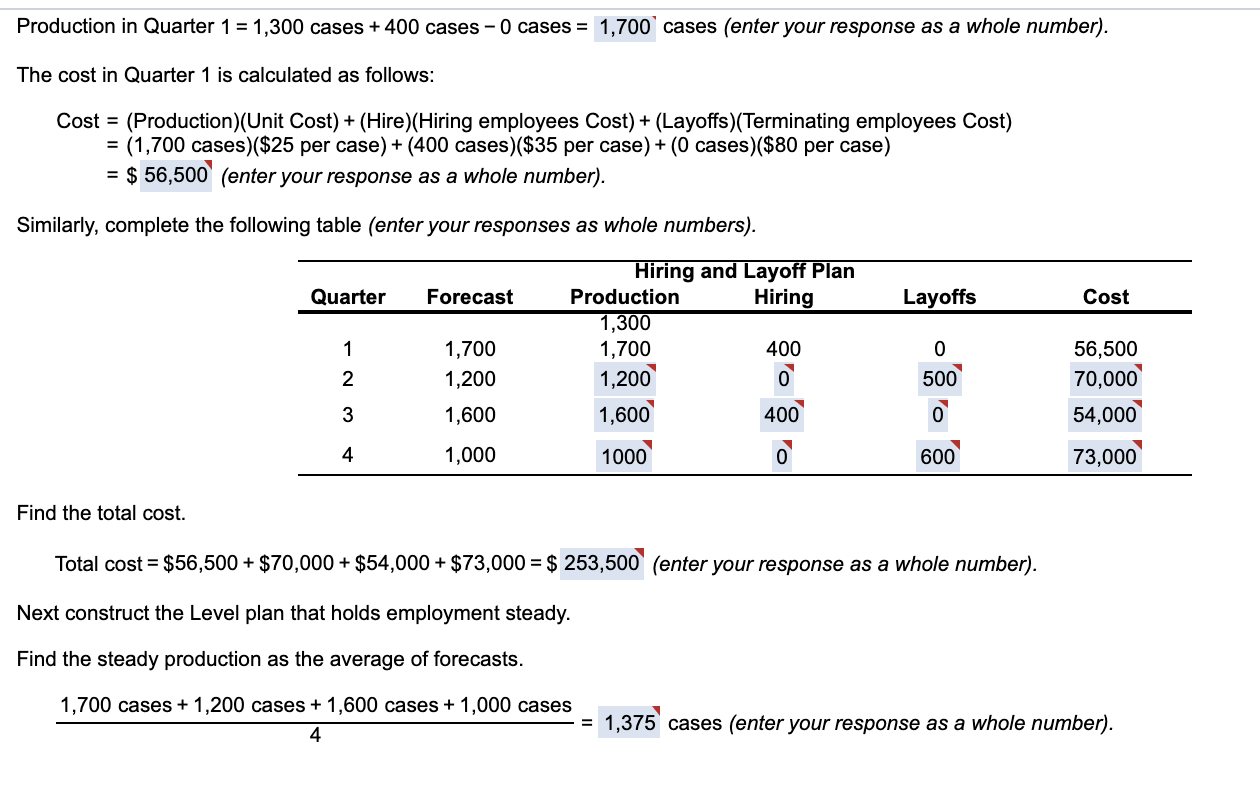
Question: The Data with a red triangle and a blue square will need to be provided with updated numbers. These photos are for representation of what
The Data with a red triangle and a blue square will need to be provided with updated numbers. These photos are for representation of what needs to be answered on this new problem.
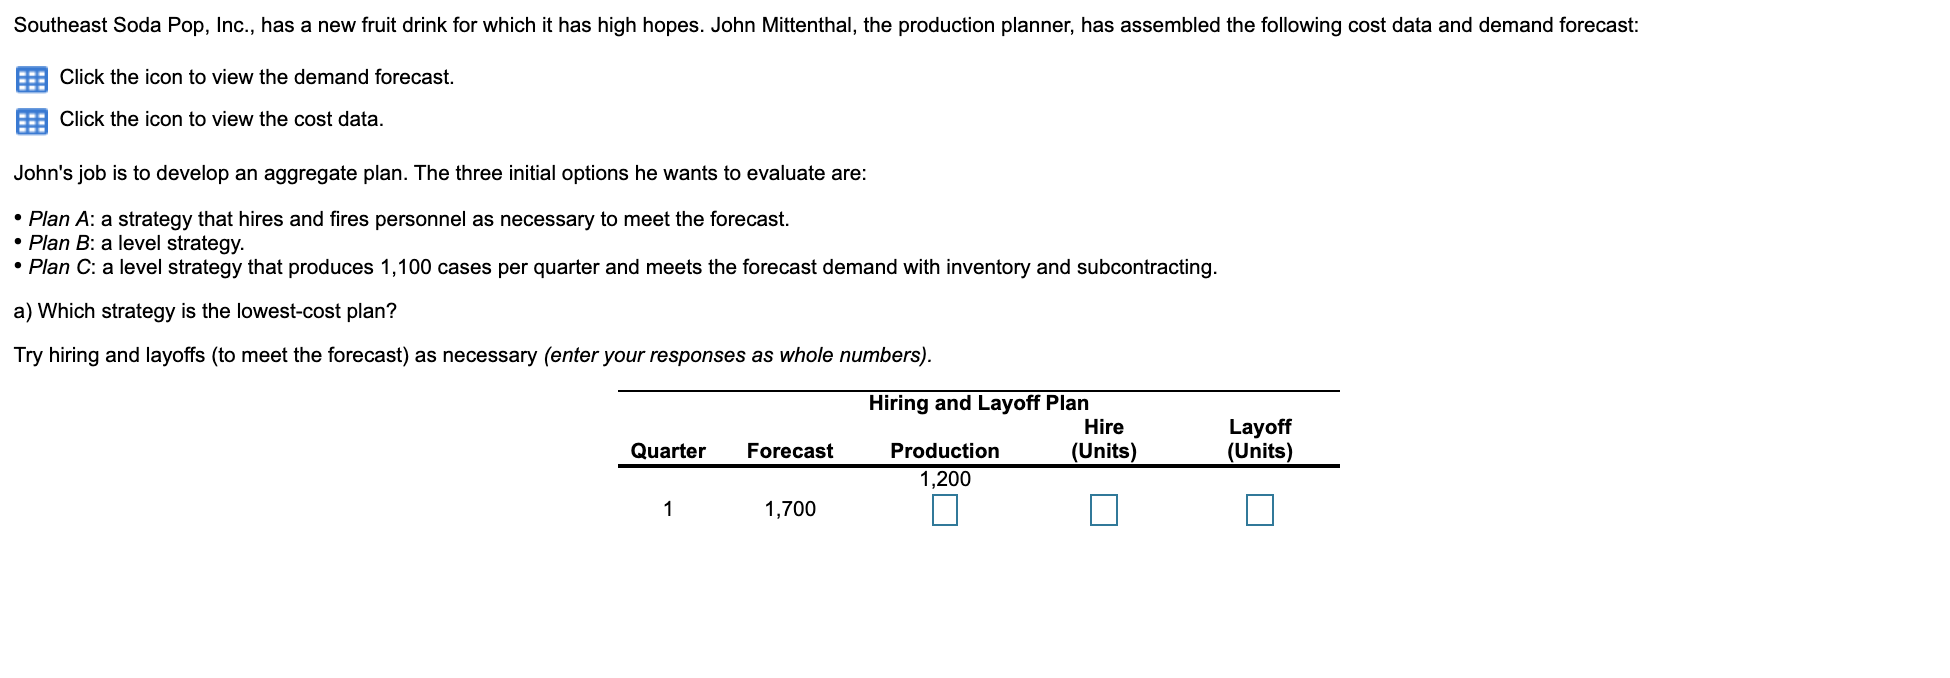
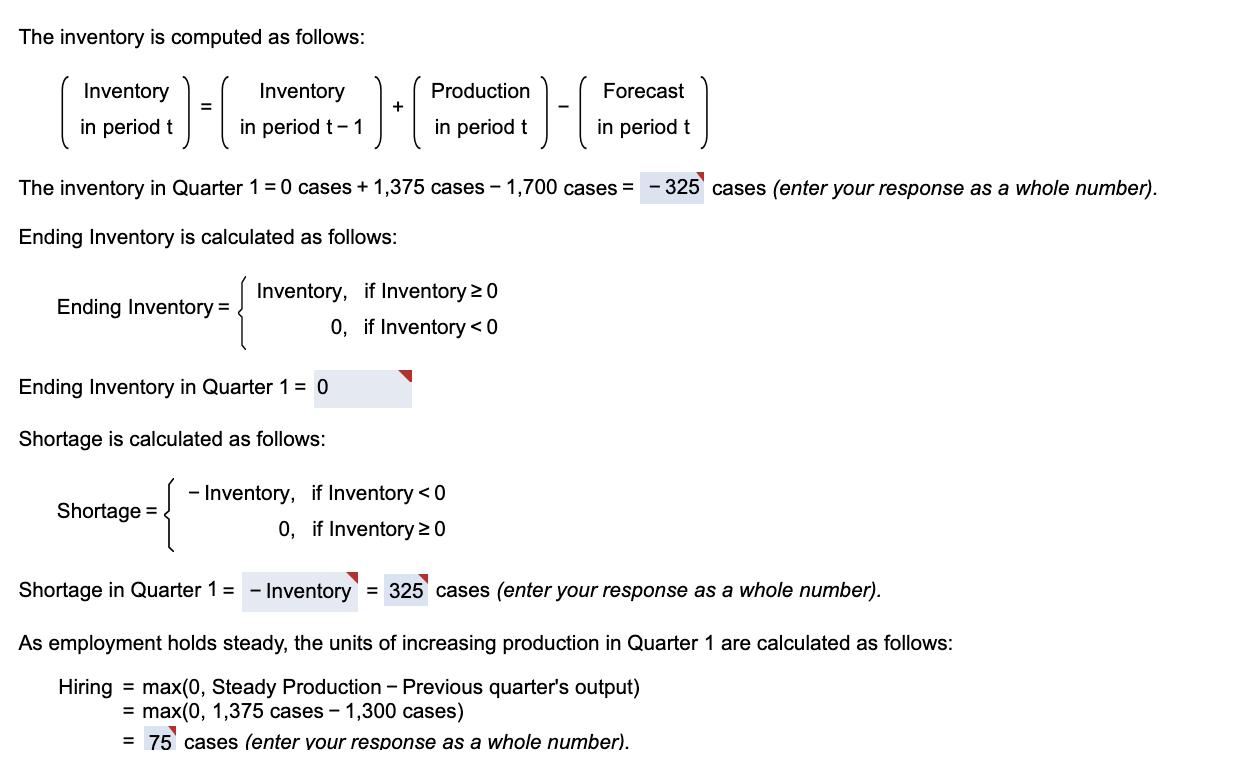
the demand forecast:
| Quarter | Forecast |
| 1 | 1,700 |
| 2 | 1,100 |
| 3 | 1,500 |
| 4 | 800 |
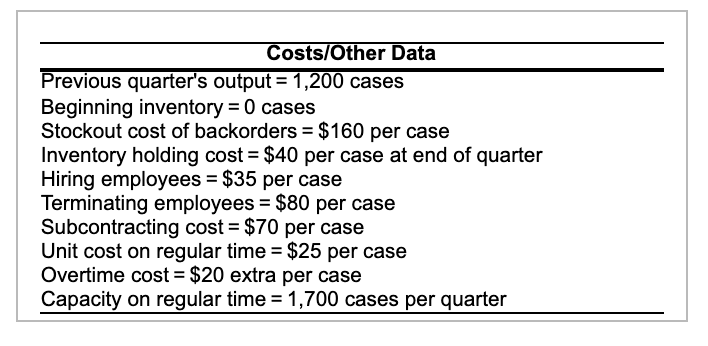
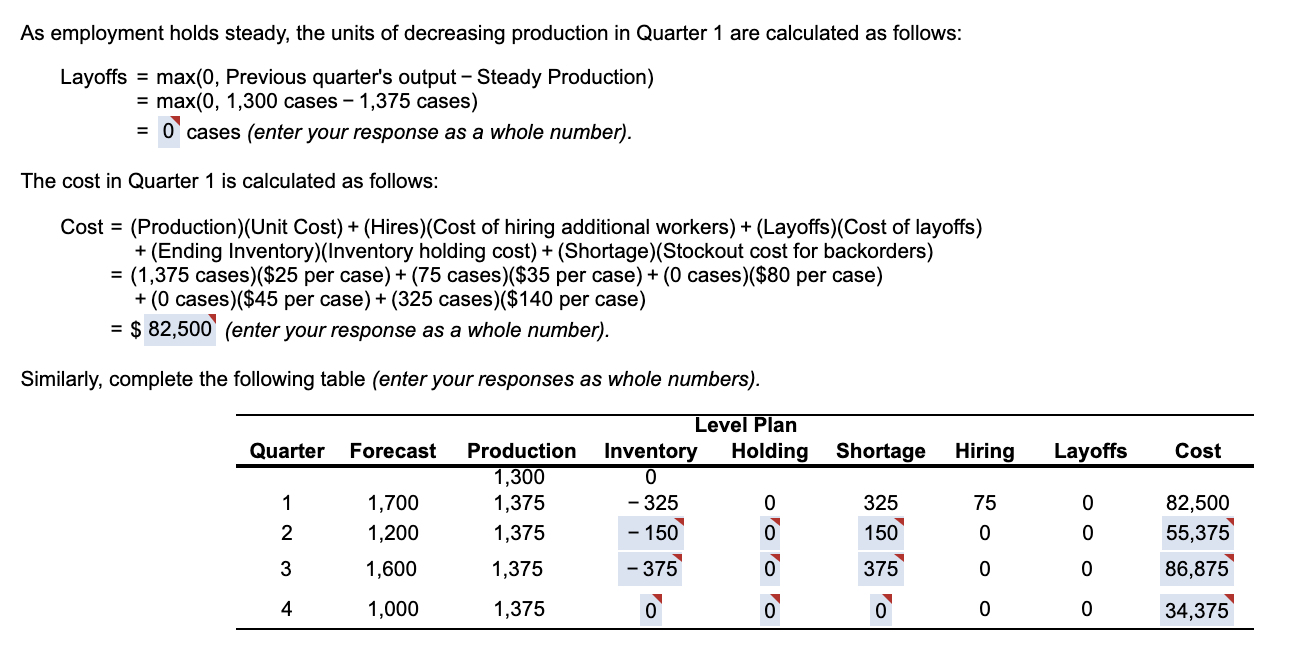
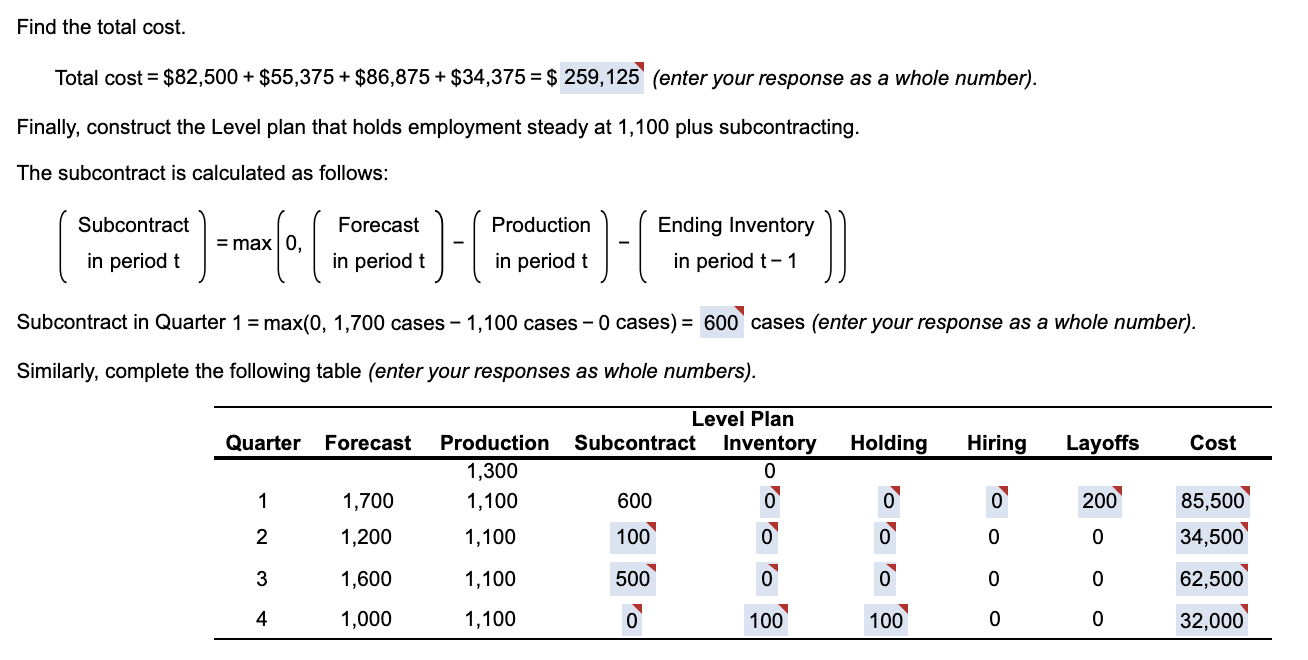
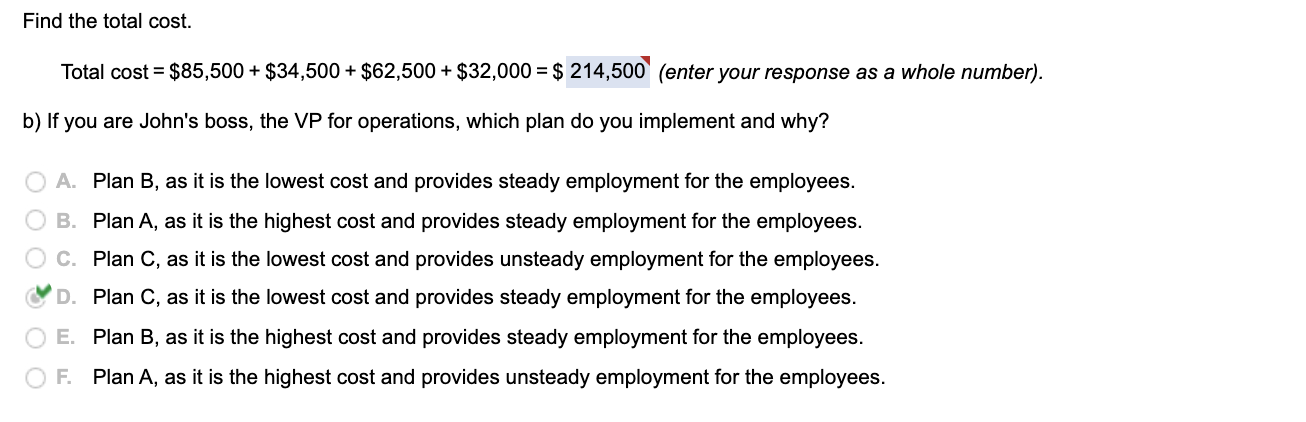
the cost data:
Step by Step Solution
There are 3 Steps involved in it
1 Expert Approved Answer
Step: 1 Unlock

Question Has Been Solved by an Expert!
Get step-by-step solutions from verified subject matter experts
Step: 2 Unlock
Step: 3 Unlock