

Question: The Data: Year Visitors 2000 325 2001 359 2002 348 2003 334 2004 380 2005 354 2006 318 2007 319 Despite the growth in digital
The Data:
| Year | Visitors |
| 2000 | 325 |
| 2001 | 359 |
| 2002 | 348 |
| 2003 | 334 |
| 2004 | 380 |
| 2005 | 354 |
| 2006 | 318 |
| 2007 | 319 |
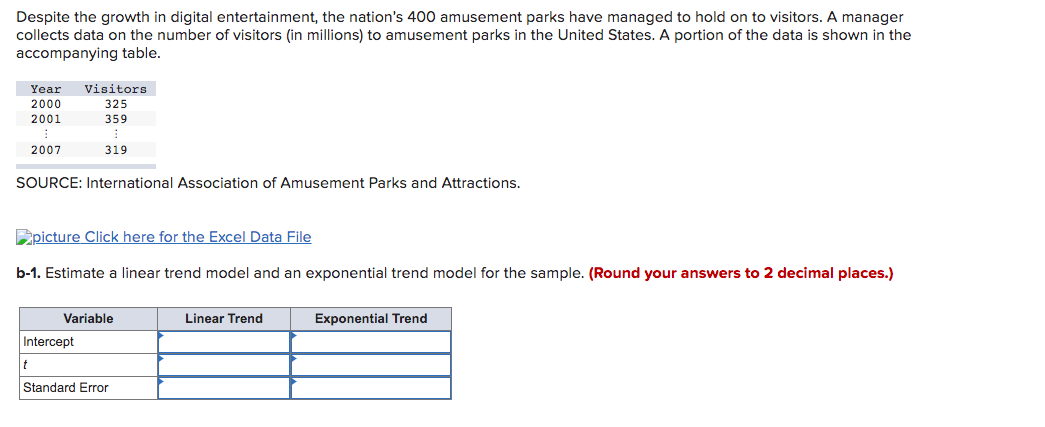
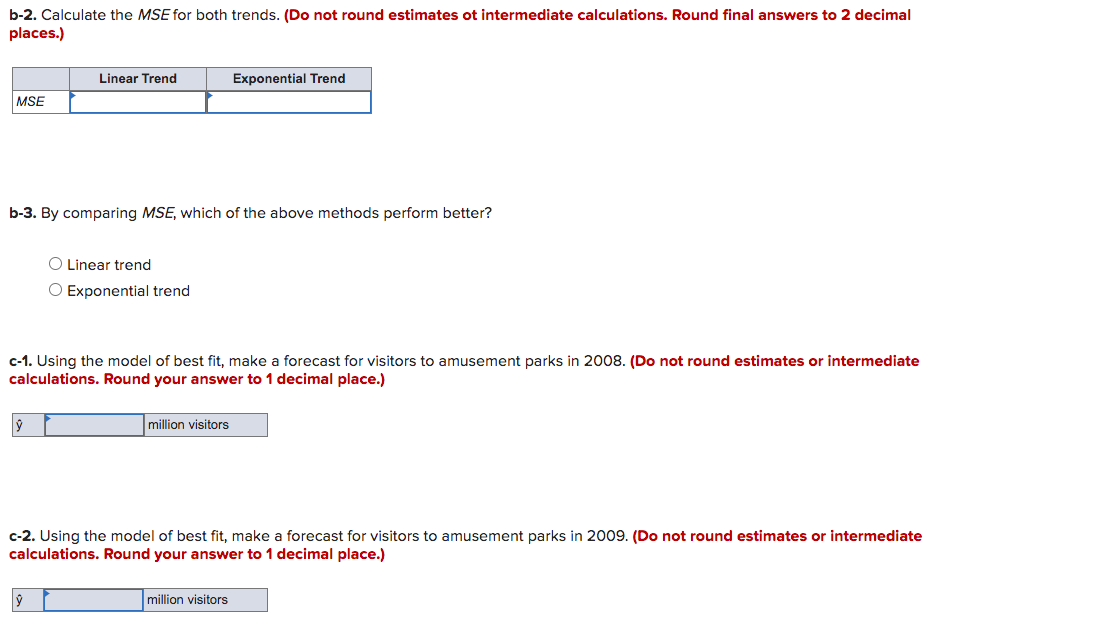
Despite the growth in digital entertainment, the nation's 400 amusement parks have managed to hold on to visitors. A manager collects data on the number of visitors (in millions) to amusement parks in the United States. A portion of the data is shown in the accompanying table. Year 2000 2001 Visitors 325 359 2007 319 SOURCE: International Association of Amusement Parks and Attractions. picture Click here for the Excel Data File b-1. Estimate a linear trend model and an exponential trend model for the sample. (Round your answers to 2 decimal places.) Linear Trend Exponential Trend Variable Intercept t Standard Error b-2. Calculate the MSE for both trends. (Do not round estimates ot intermediate calculations. Round final answers to 2 decimal places.) Linear Trend Exponential Trend MSE b-3. By comparing MSE, which of the above methods perform better? O Linear trend Exponential trend C-1. Using the model of best fit, make a forecast for visitors to amusement parks in 2008. (Do not round estimates or intermediate calculations. Round your answer to 1 decimal place.) million visitors c-2. Using the model of best fit, make a forecast for visitors to amusement parks in 2009. (Do not round estimates or intermediate calculations. Round your answer to 1 decimal place.) million visitors
Step by Step Solution
There are 3 Steps involved in it
1 Expert Approved Answer
Step: 1 Unlock

Question Has Been Solved by an Expert!
Get step-by-step solutions from verified subject matter experts
Step: 2 Unlock
Step: 3 Unlock