

Question: The data3 The data below represent the number of days absent, x, and the final grade, y, for a sample of college students at a
The data3
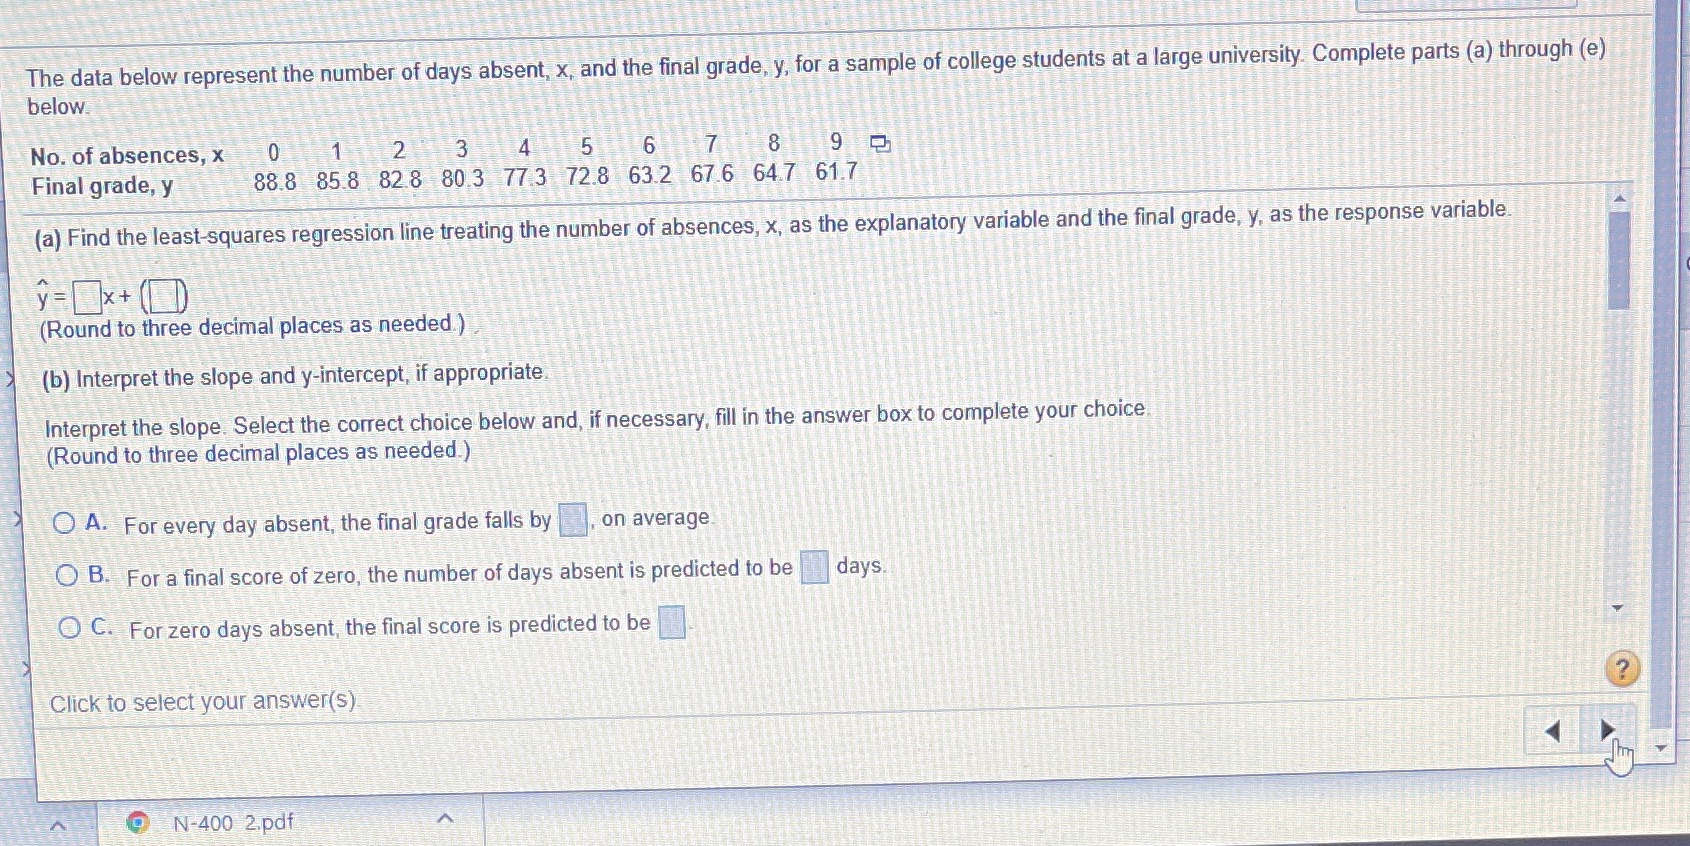
The data below represent the number of days absent, x, and the final grade, y, for a sample of college students at a large university. Complete parts (a) through (e) below. No. of absences, x 0 1 2 3 4 5 6 7 8 Final grade, y 88.8 85.8 82 8 80.3 77 3 72.8 63.2 67 6 64.7 61.7 (a) Find the least-squares regression line treating the number of absences, x, as the explanatory variable and the final grade, y, as the response variable. y =x + (D (Round to three decimal places as needed.) (b) Interpret the slope and y-intercept, if appropriate. Interpret the slope. Select the correct choice below and, if necessary, fill in the answer box to complete your choice (Round to three decimal places as needed.) O A. For every day absent, the final grade falls by on average O B. For a final score of zero, the number of days absent is predicted to be days O C. For zero days absent, the final score is predicted to be ? Click to select your answer(s) N-400 2.pdf
Step by Step Solution
There are 3 Steps involved in it

Get step-by-step solutions from verified subject matter experts